
Resource Monitoring Chart
Resource Monitoring Chart area
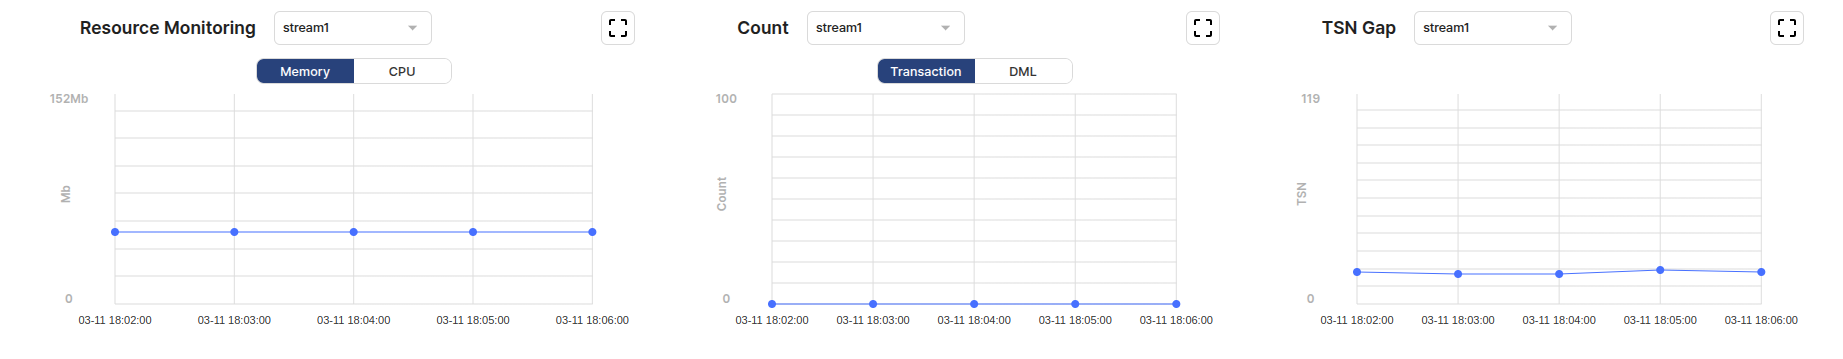
Detailed view area
Resource Monitoring
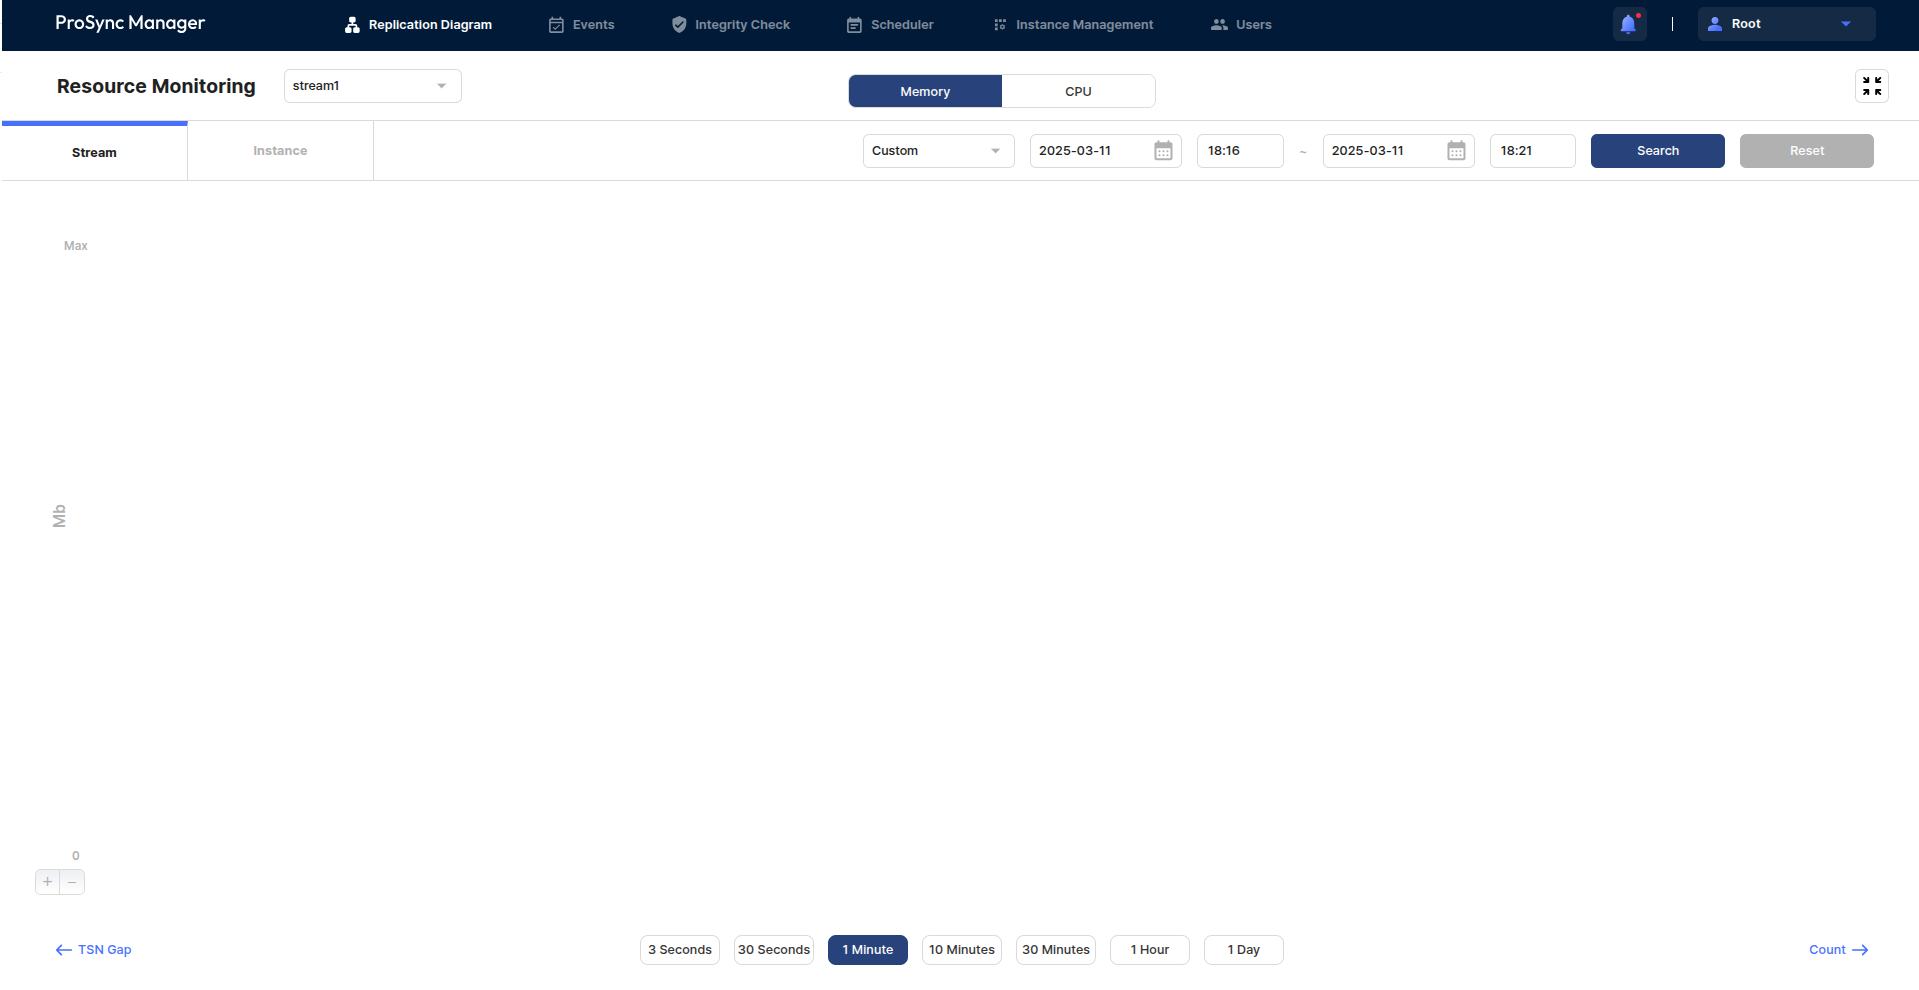
Memory / CPU button
Stream / Instance tab
Search
Chart area
Select interval
Zoom in and out buttons
Count
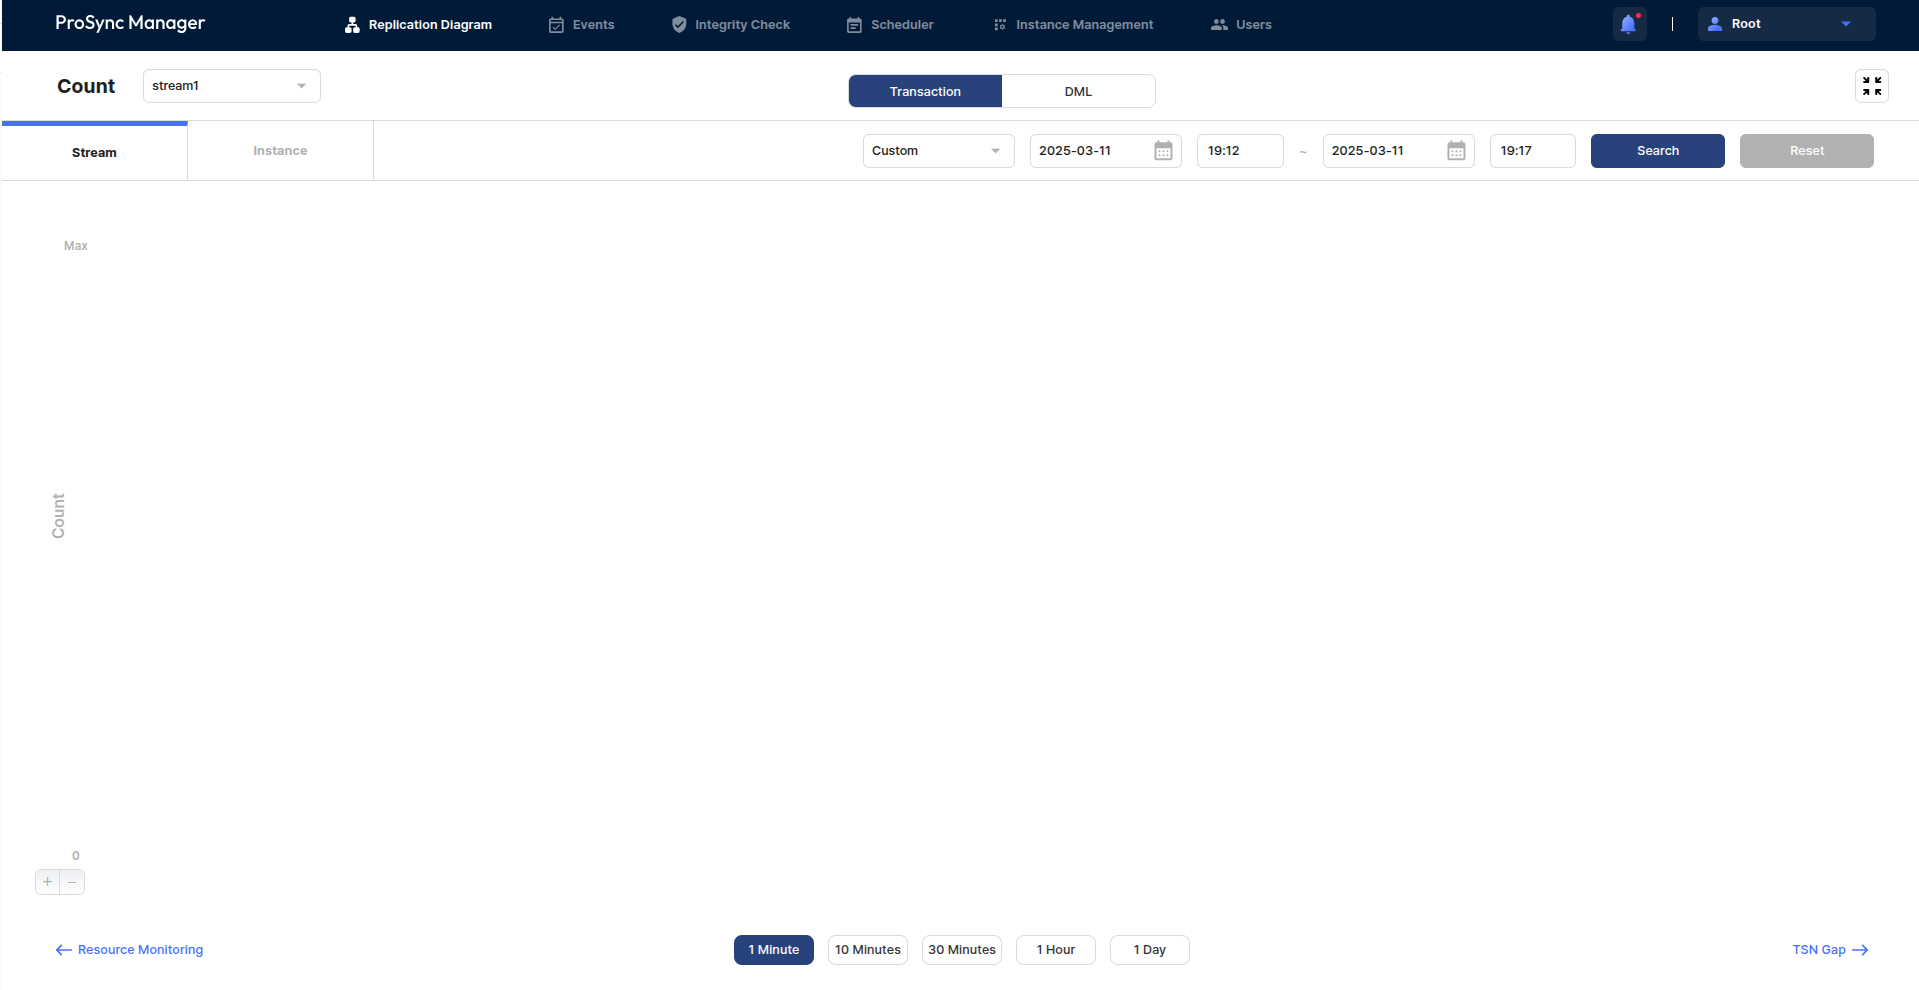
Transaction / DML button
Stream / Instance tab
Search
Chart area
Select interval
Zoom in and out buttons
TSN Gap
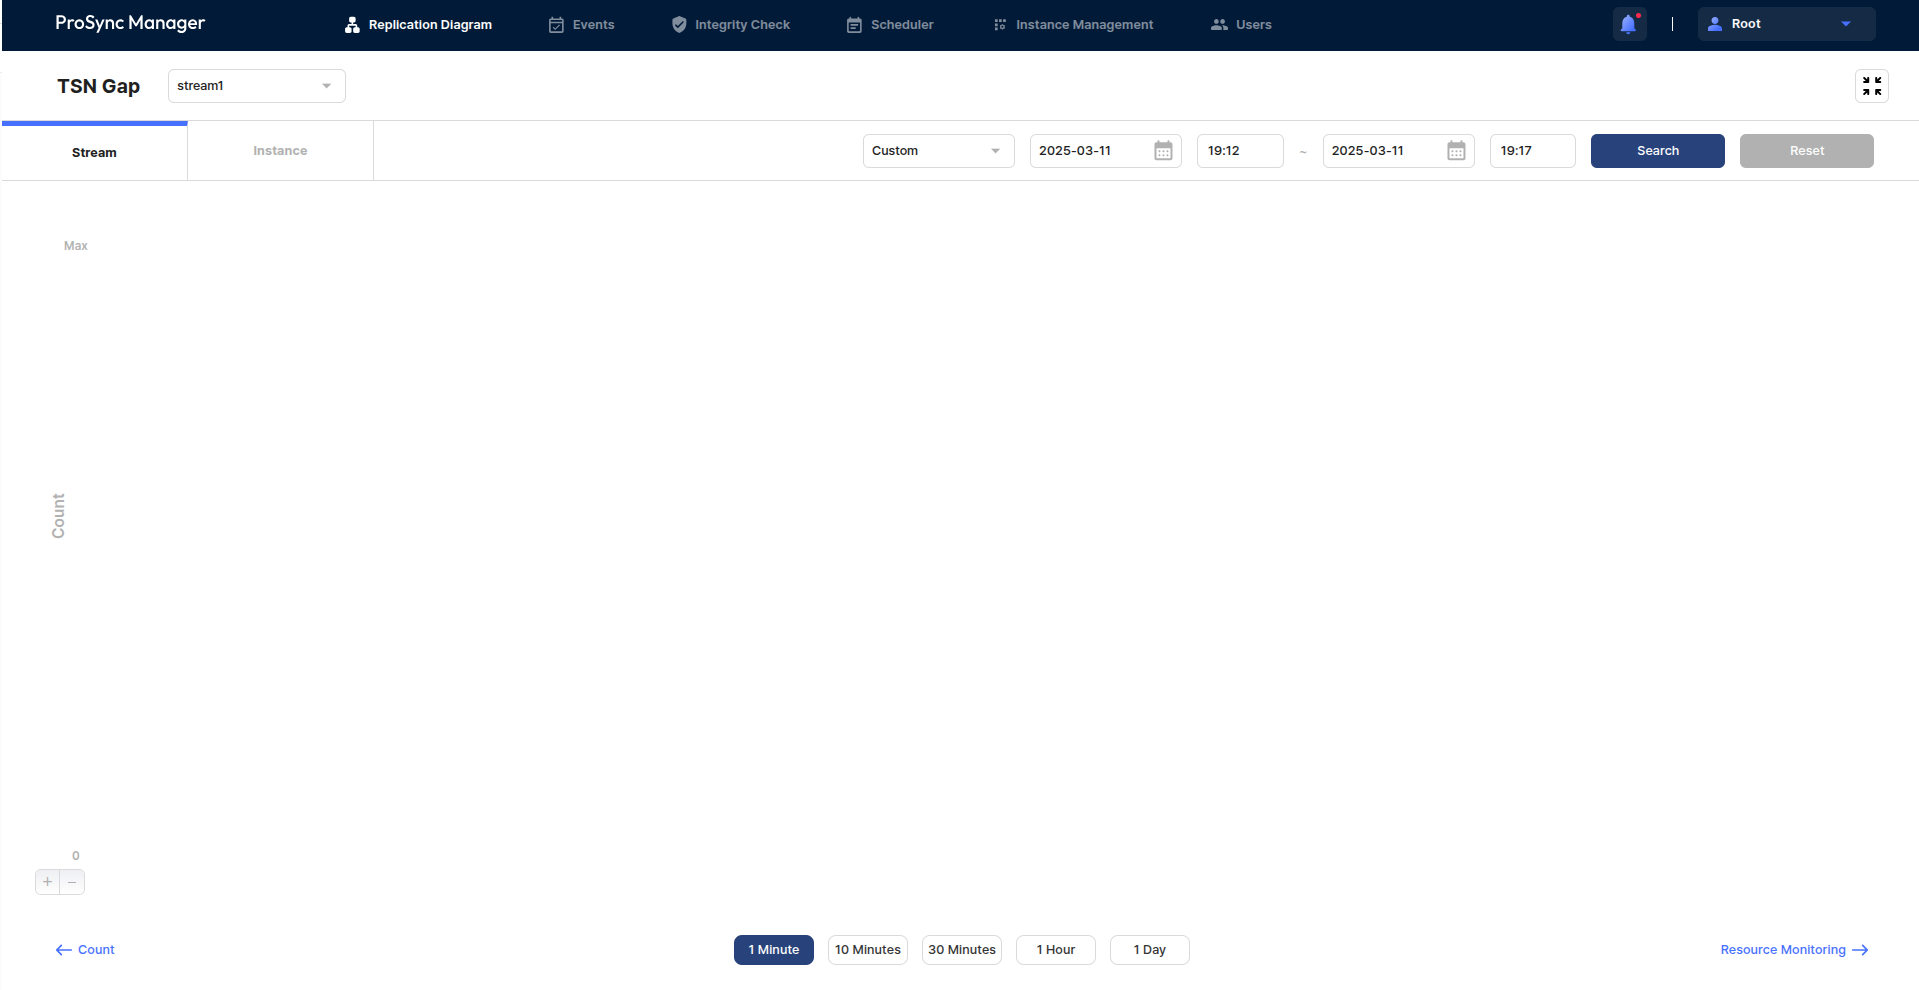
Stream / Instance tab
Search
Chart area
Select interval
Zoom in and out buttons
Last updated