
Dashboard
Provides summary information and notifications about the status of all running databases and instances. The users can view the dashboard by clicking the OwlDB Console > OwlDB logo.
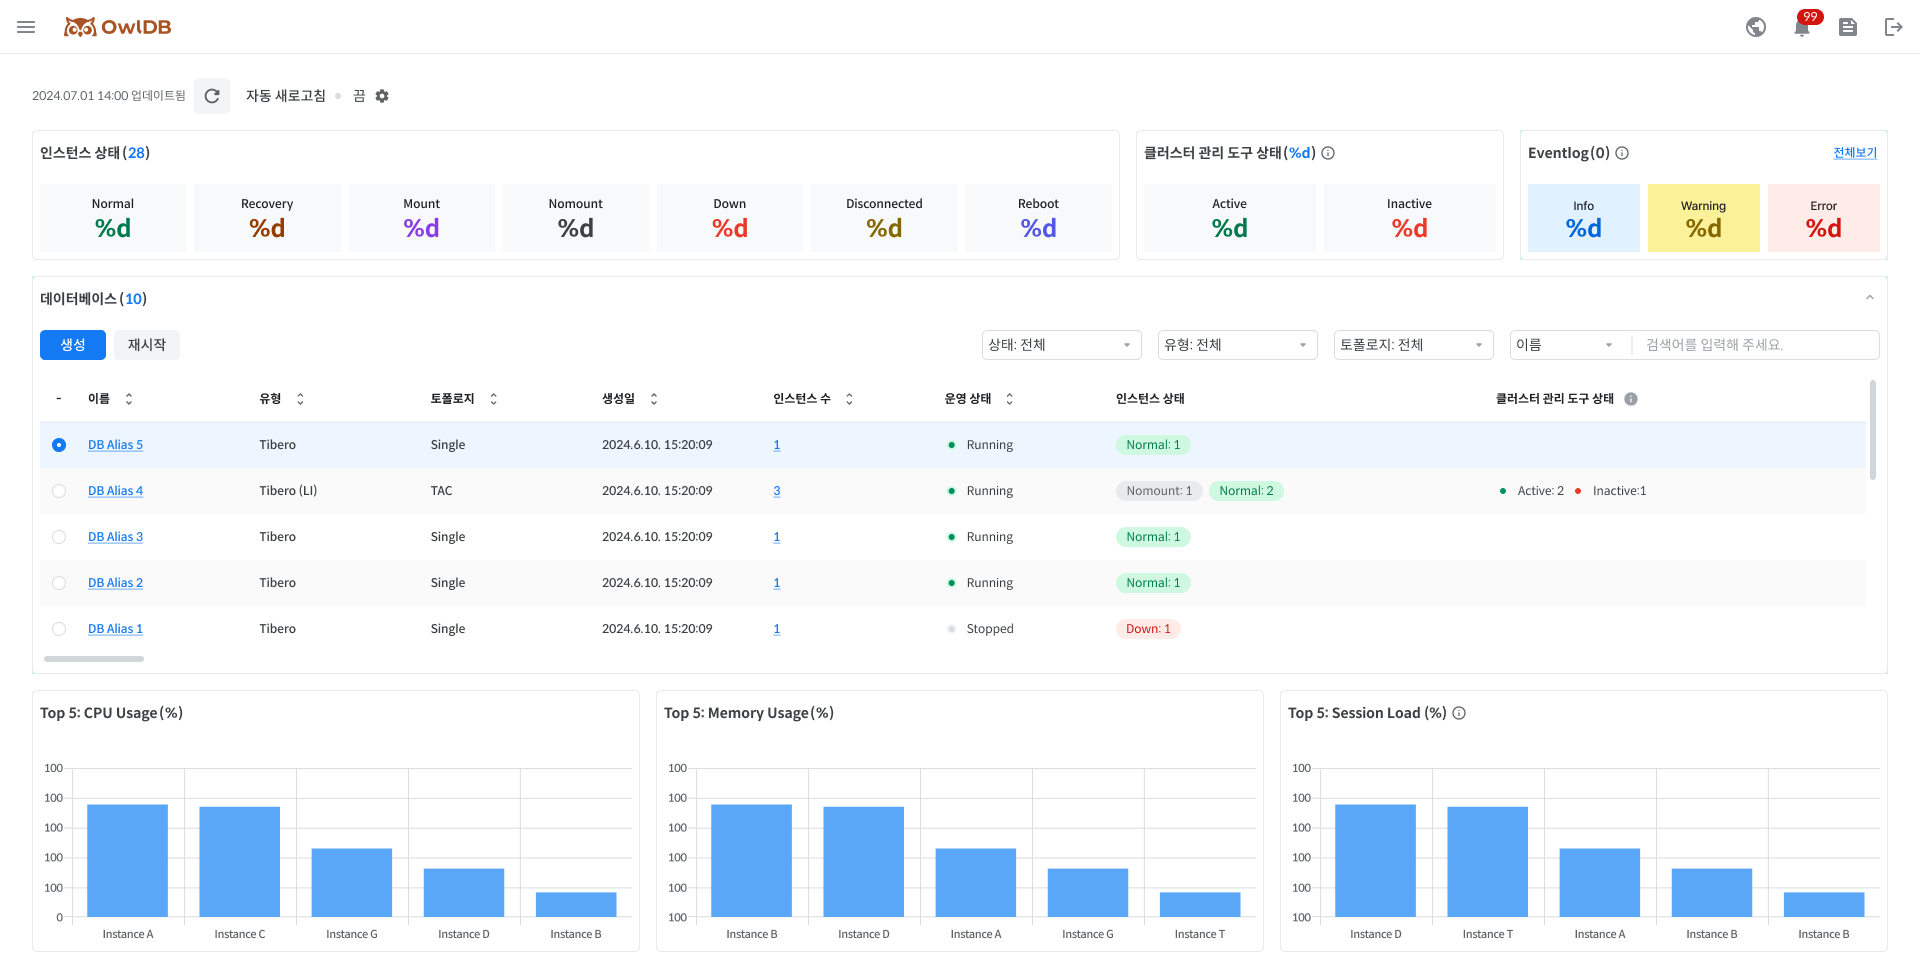
The summary of overall status
Check the status of all running instances, cluster management tools, and Eventlog. Click each status to see a list of databases with that status value in the 'Database list'.
Note
Cluster management tool is a component required to operate the databases in the cluster configuration. (ex. Tibero Cluster Manager (CM), Pgpool, etc.) Depending on the database engine and topology, there may be no cluster management tool. Please refer to 'Database Engine / Version / Topology'.
Normal
Normal operating
Recovery
Recovering
Mount
State of connecting Tibero to the instance started in the Nomount phase to read the Control File
NoMount
Only Tibero's process is started (in the case of creating a database using the CREATE DATABASE statement)
Down
The database is not running or has been terminated.
Disconnect
The connection between the database and the Agent is disconnected, or the Agent is abnormal due to other factors.
Reboot
Restarting in progress
Active
Cluster Management Tools is in normal operation.
Inactive
Inactive state when the Cluster Management Tool is unresponsive for more than three seconds during a health check.
-
No Cluster Management Tool
Note
If the instance is normal even if the Cluster Management Tools status is Inactive, the instance status is displayed as Normal.
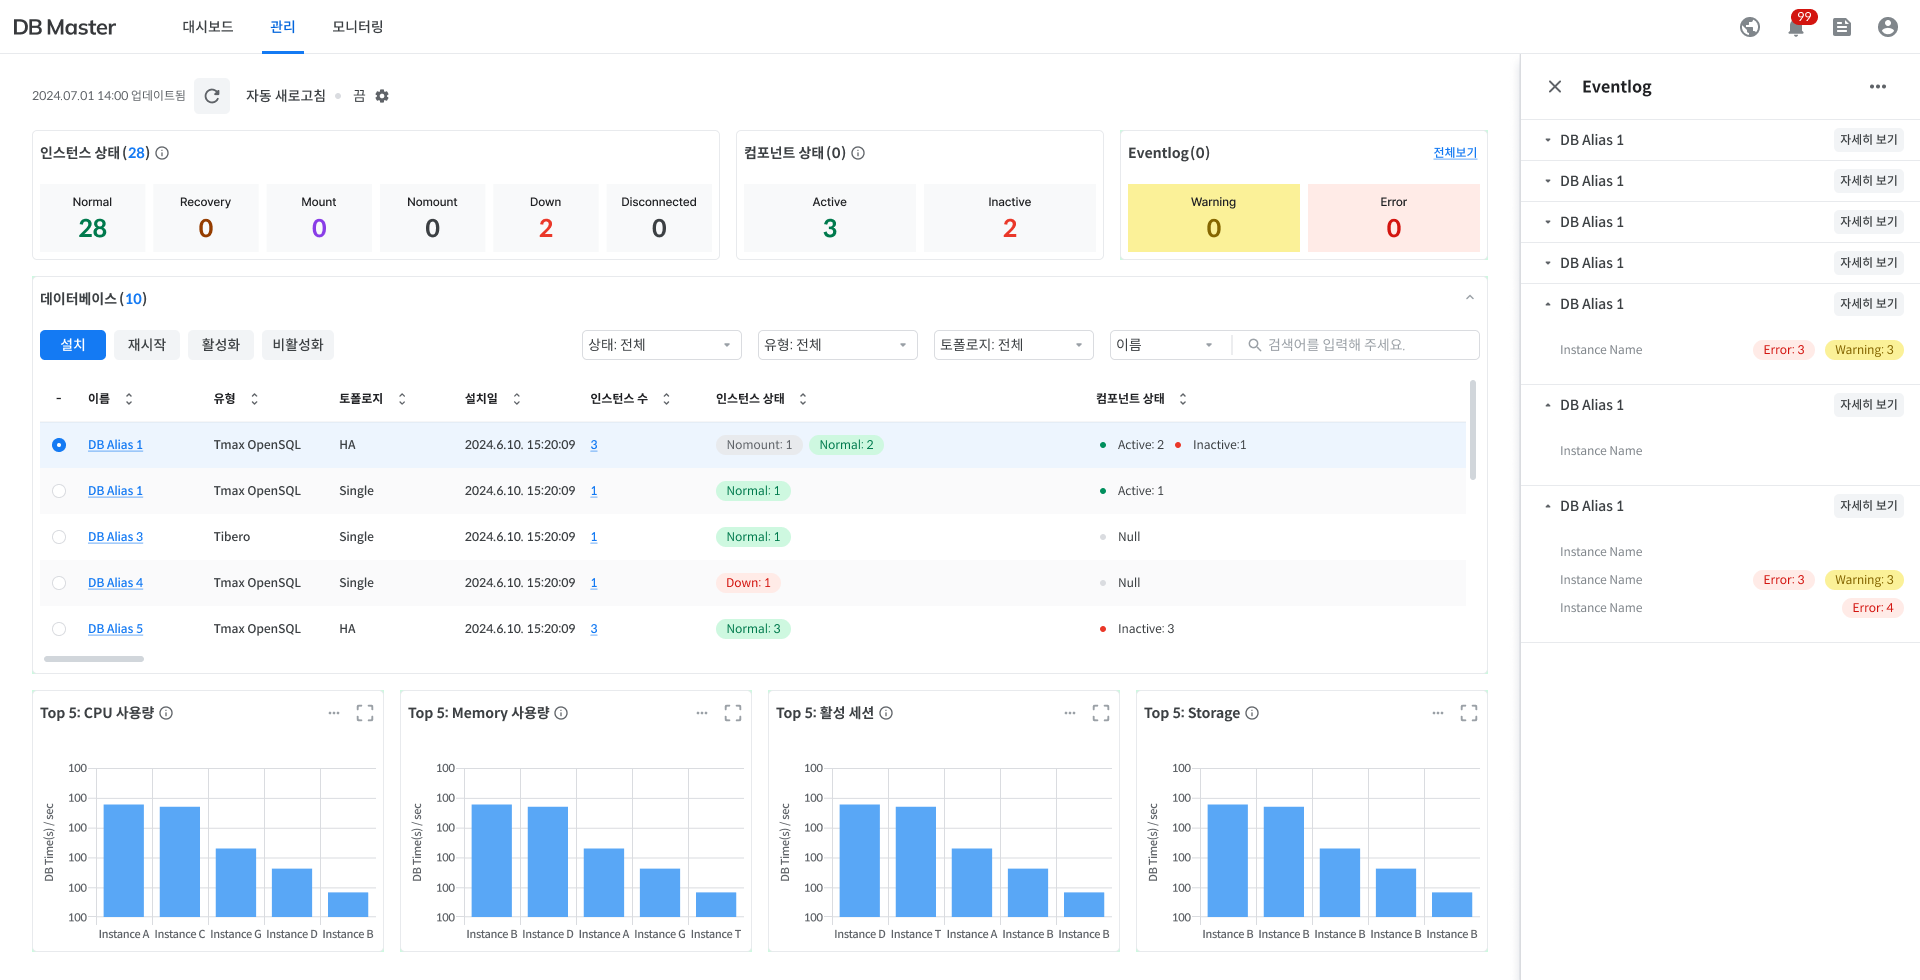
Note When the users click Dashboard > Eventlog > Full view > Side panel > More details, the users will be taken to the "Log monitoring > Eventlog" page.
Info
If the instance state changes.
Warning
CPU usage exceeds 50.
Memory usage exceeds 50
Error
CPU usage exceeds 90
Memory usage exceeds 90
Provisioning
The status of creating and setting up the server environment and database.
Running
All resources are available for normal use.
Modifying
Specification changes are in progress.
Migrating
Data migration is in progress.
Stopping
Switching all resource usage to Stopped
Stopped
The state of temporarily disabling all resources (disabling resources)
Pending
The status of transitioning from Stopped to Running
Terminating
The status of permanently deleting all resources and data (when finished, they cannot be accessed and recovered)
The database list
View a list of all running databases. The list of databases the users see depends on the status value the users pulled down in 'The summary of overall status'.
The users can filter the database type and topology.
The users can also search for a database name directly.
Name
Database alias
Click to go to the 'Database management' page.
Type
Database type
Topology
Database configuration
Creation date
Database creation date
Instance count
The number of instance in the database.
Click to see 'the instance list' in the right side panel.
Operational status
Database operational status
Instance status
The status of instance in the database
Cluster management tool status
The status of cluster management tool
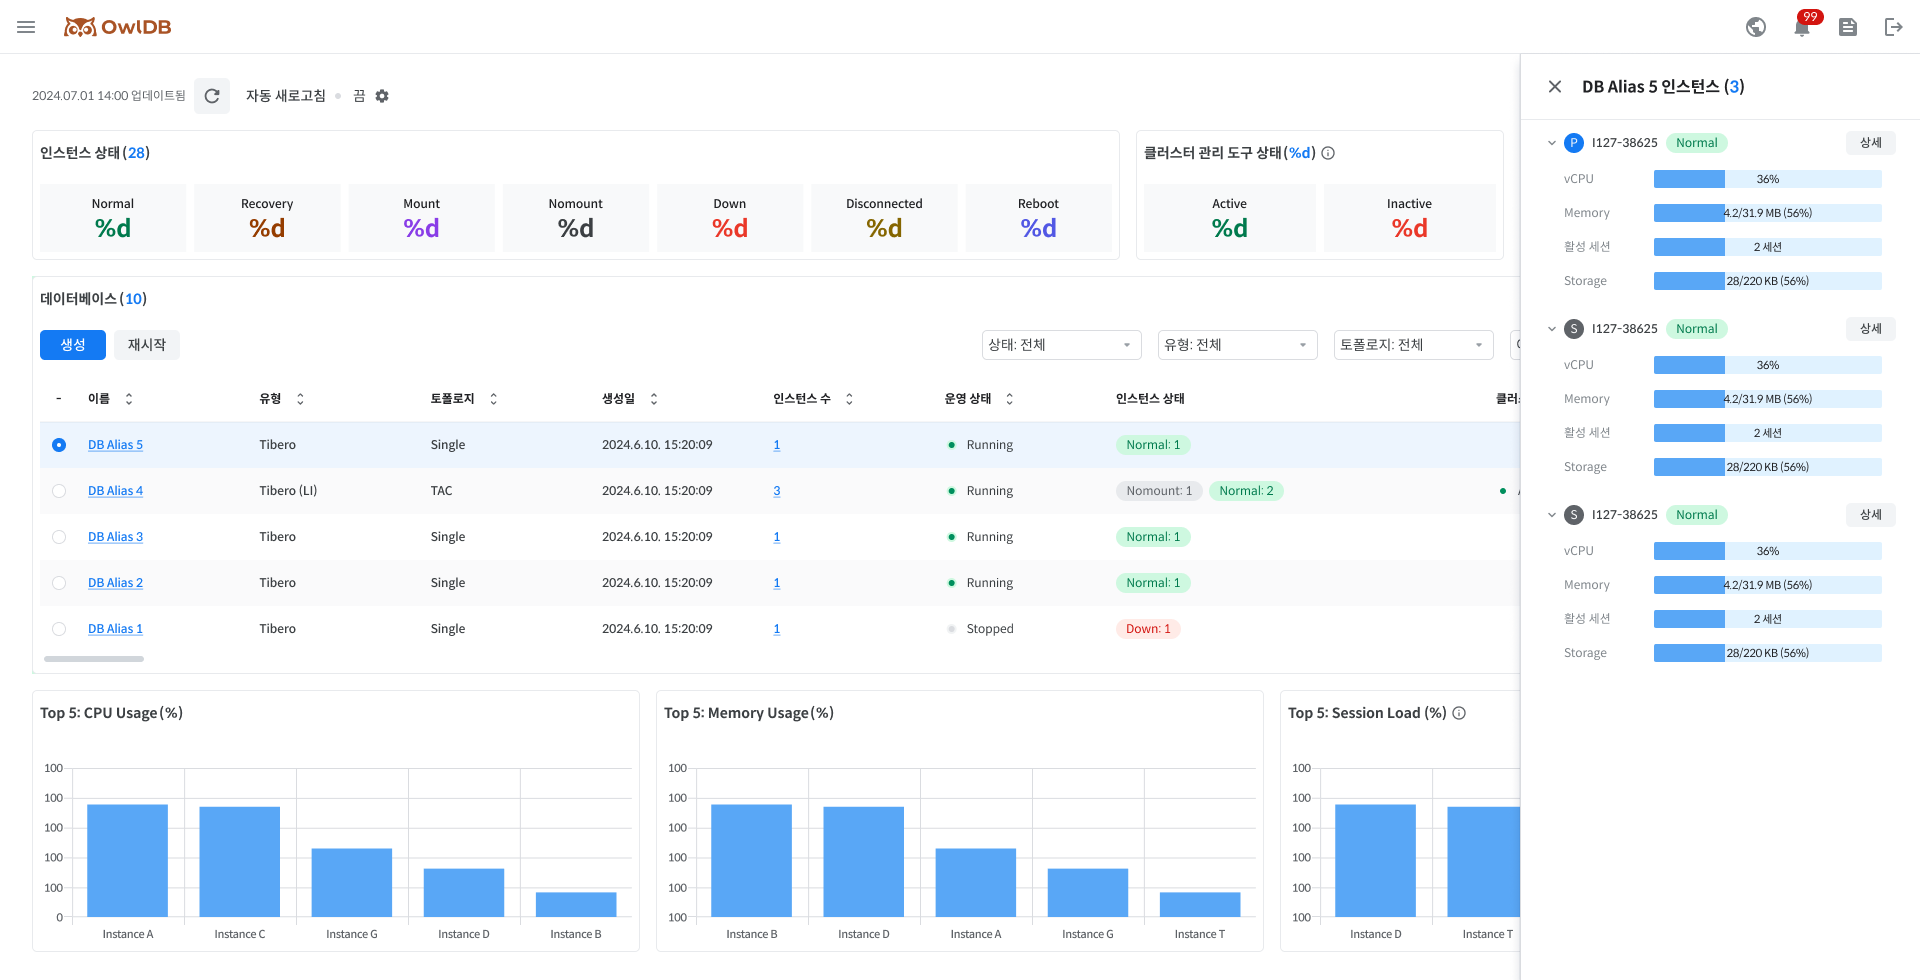
The instance list
Check the list of instances that make up the configuration of a specific database.
Click 'Instance count' in 'The database list' and the users can see the list of instances in the right side panel.
If the users click the Details button, the users will be taken to the 'Instance management' page.
The live chart
Check the real-time chart for the top 5 instances per item.
CPU Usage (%)
Real-time CPU usage
Memory Usage (%)
Real-time Memory Usage
Session Load (%)
(Active Session/Max Session)X100, indicating the session load level.
Auto-refresh
For the real-time updates of the dashboard, OwlDB supports auto-refresh function. The users can set the refresh cycle by clicking ⚙️icon in the upper left corner.
Last updated