
SQL Detail Tab
Displays the past execution history and statistics of SQL statements identical to those currently being executed in the current session.
Select the time period for the SQL execution history
To view the history of SQL statements that are identical to those currently being executed in the current session, the users can select the desired period and view the history.
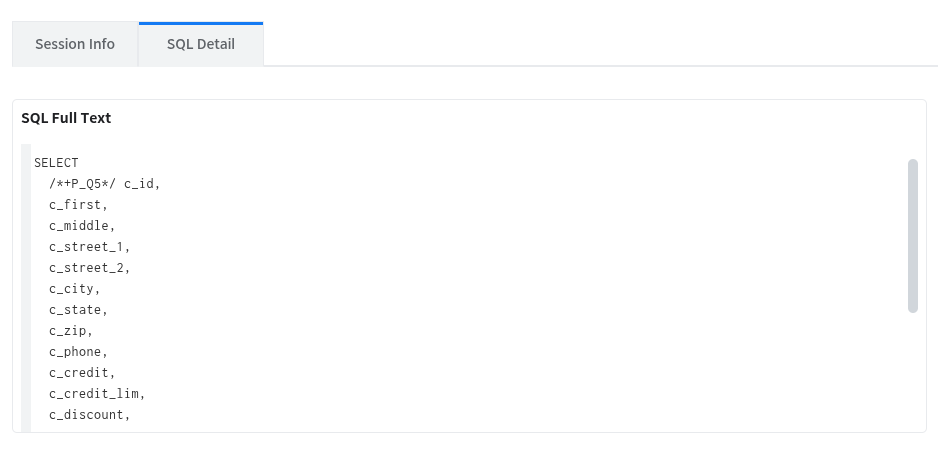
SQL Full Text
Displays the full text of the SQL currently being executed in the current session.
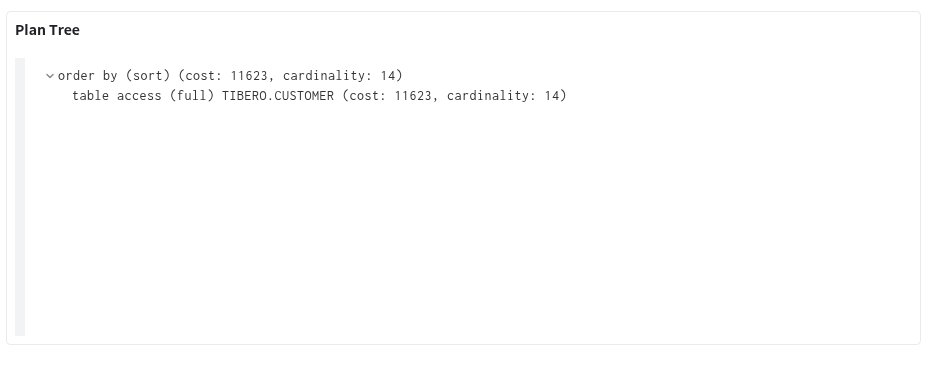
Plan Tree
This screen allows the users to view the plan for the SQL currently being executed in the current session. The SQL plan is displayed in a tree structure.
SQL Execution History Statistics
Displays statistical information about the past history of SQL statements identical to the currently executing SQL. Displays Summary, execute count, physical reads, logical reads, plan history, and SQL trace items.
Summary
The Summary tab displays stat indicators and a list of wait events for the analysis period, as well as the wait time values for each wait event.
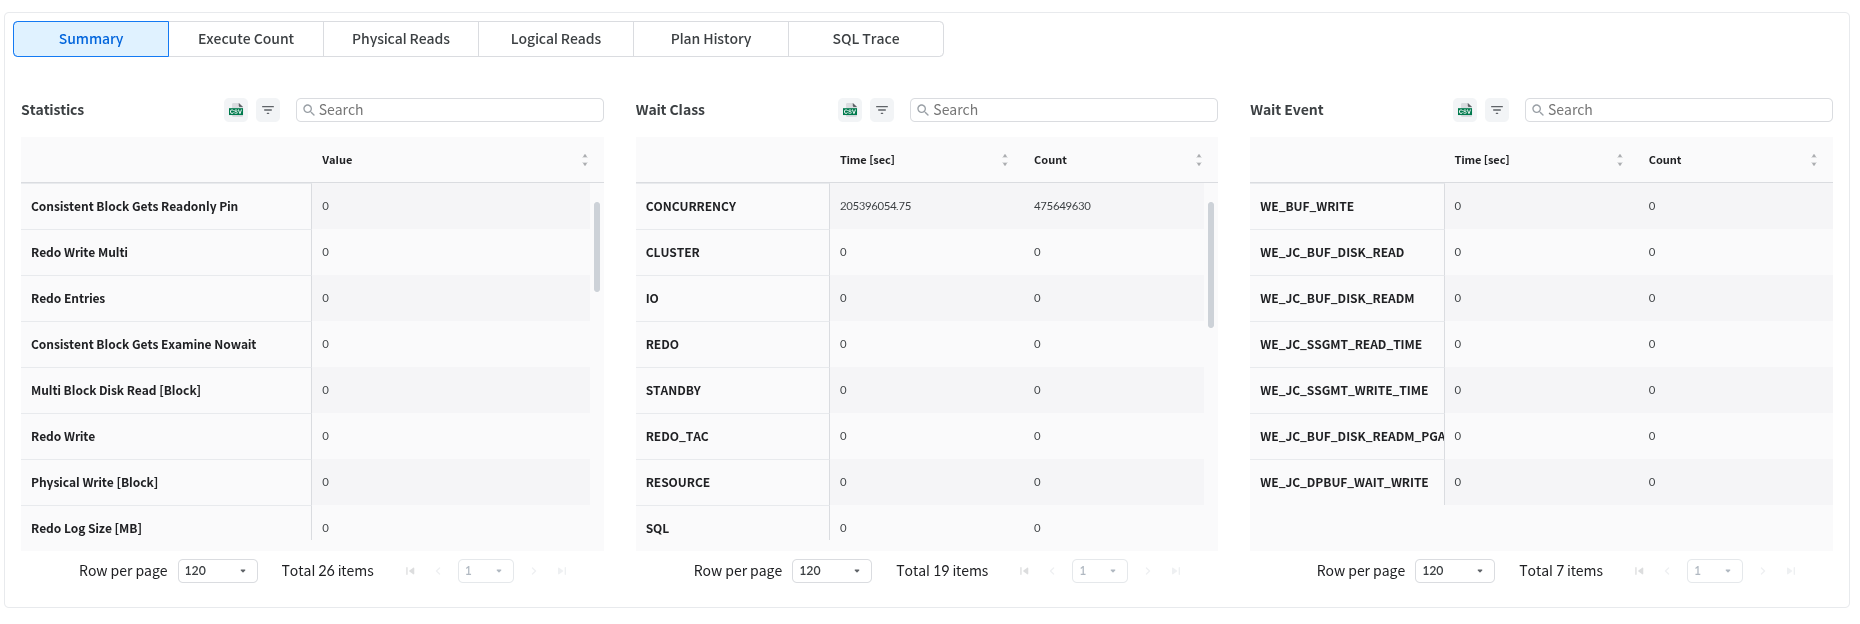
Statistics
View statistics metrics
Wait Class
View the list of wait classes during the analysis period and the wait time values for each wait class
Wait Event
View detailed information about the selected item in the wait class
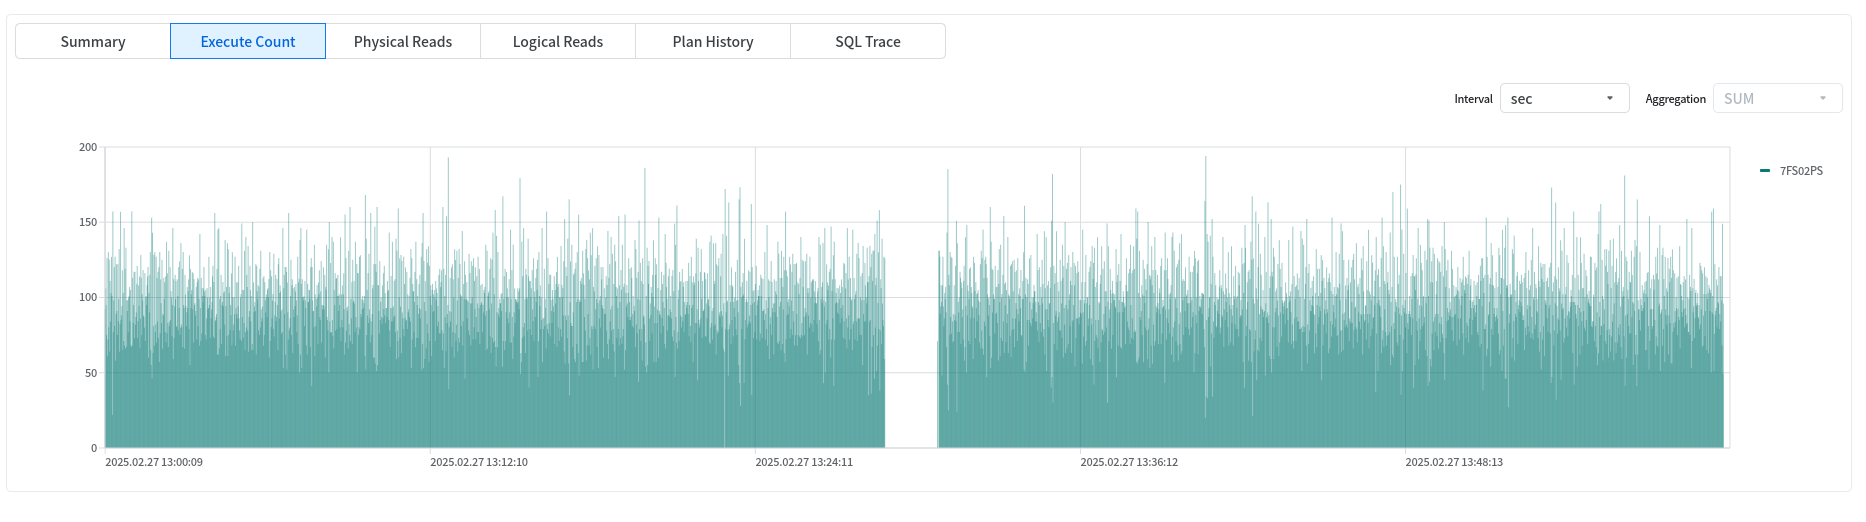
Execute count
The Execute Count tab displays the Execute Count by time unit in a chart format.
Physical Reads
On the Physical Reads tab screen, the users can view the Physical Reads by time unit in chart form.
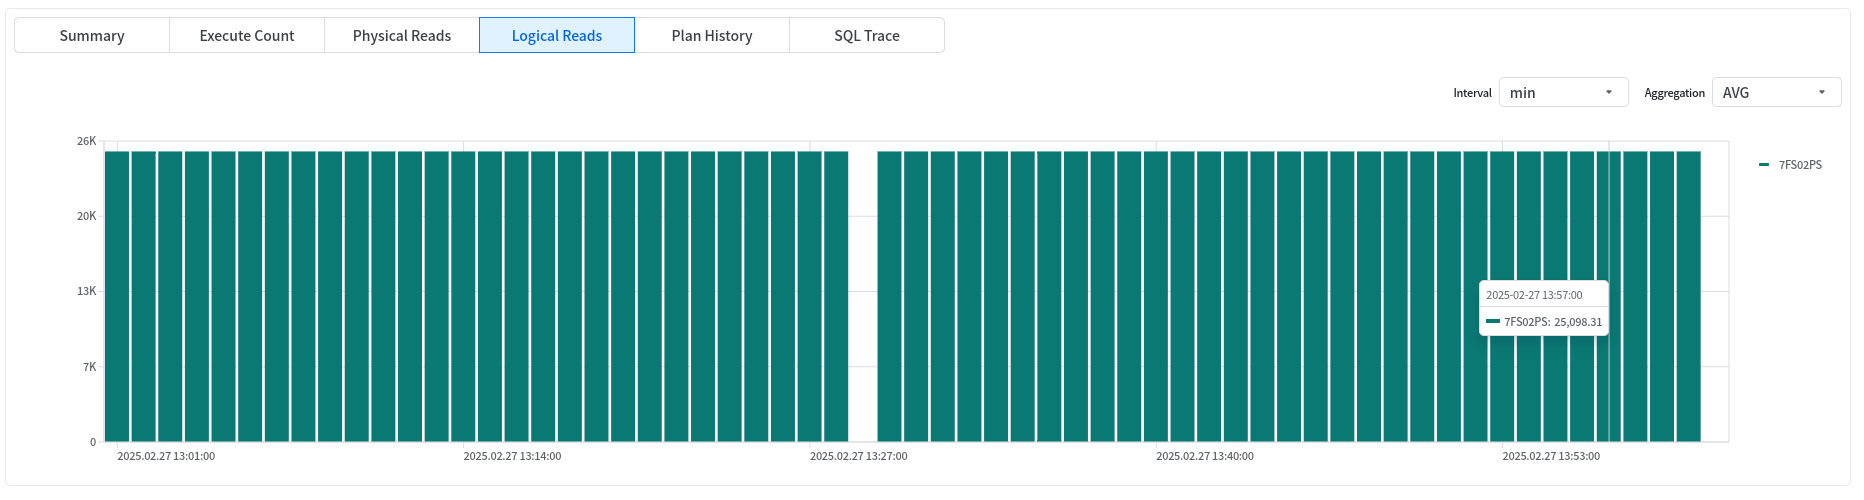
Logical Reads
On the Logical Reads tab screen, the users can view Logical Reads in chart form by minute.
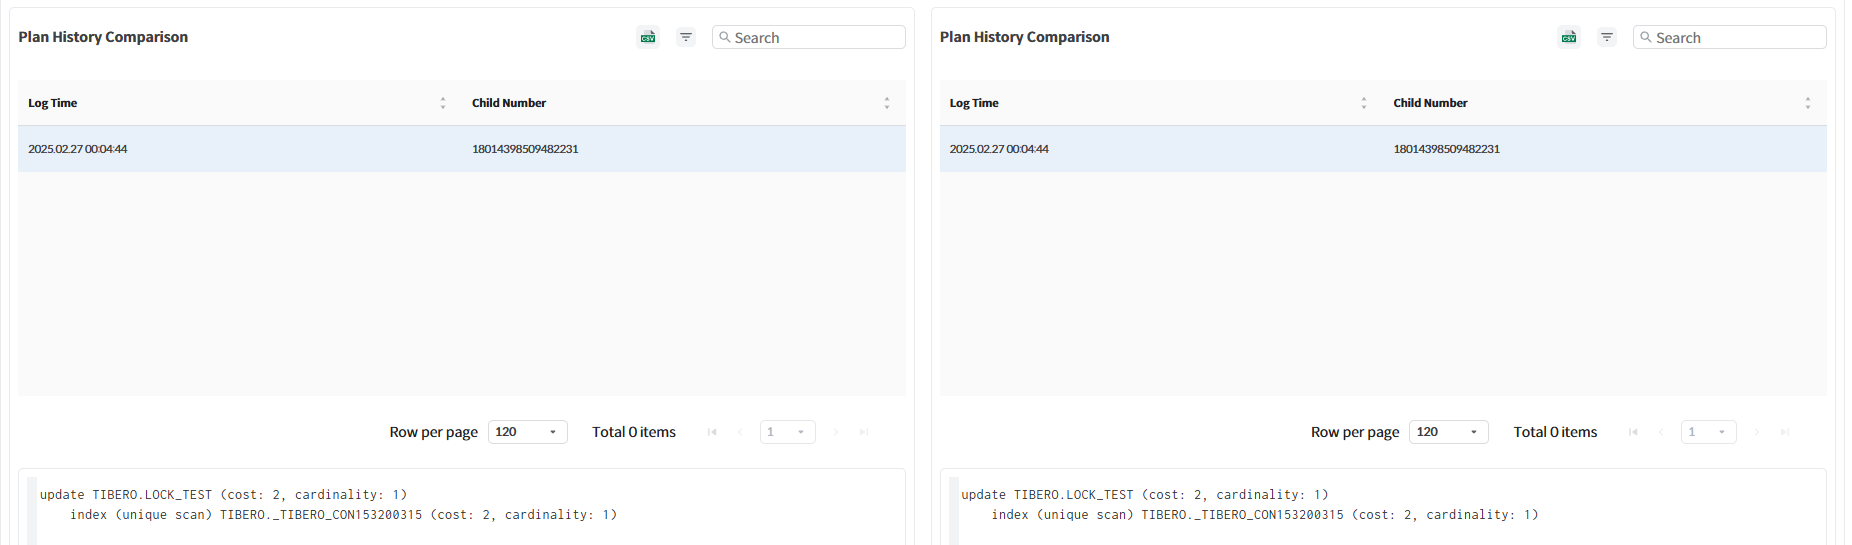
Plan History
The Plan History tab screen allows the users to compare plans for the same query.
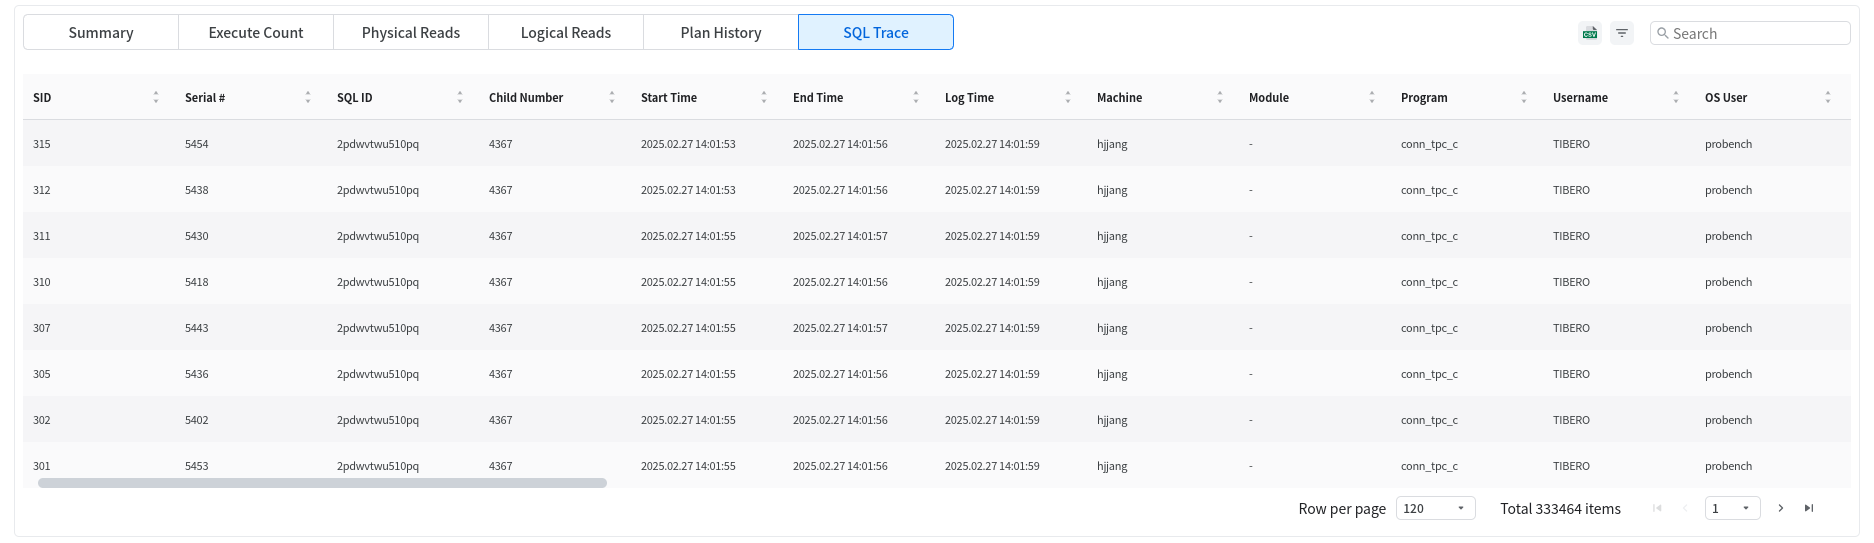
SQL Trace
The SQL Trace tab displays the SQL execution history (trace information) for the specified query period.
Note
Due to an issue with the Tibero library used to collect SQL execution history, some information such as Machine, Module, Program, Username, and OS User may not be collected.
When the child number of an SQL trace is 0, it indicates that the SQL plan allocation failed for various reasons. Additionally, if the execution time up to the point where the SQL plan generation fails exceeds the SQL_STAT_HISTORY_THRESHOLD set by the user, the SQL trace with the failed SQL plan generation is collected. In conclusion, when the child number of a collected SQL trace is 0, there is no mapped SQL plan, so the SQL plan cannot be viewed.
Last updated