Loading...
Loading...
Loading...
Loading...
Loading...
Loading...
Loading...
Loading...
Loading...
Loading...
Loading...
Loading...
Loading...
Loading...
Loading...
Loading...
Loading...
Loading...
Loading...
Loading...
Loading...
Loading...
Loading...
Loading...
Loading...
Loading...
Loading...
Loading...
Loading...
Loading...
Loading...
Loading...
Loading...
Loading...
Loading...
Loading...
Loading...
Loading...
Loading...
Loading...
Loading...
Loading...
Loading...
Loading...
Loading...
Loading...
Loading...
Loading...
Loading...
Loading...
Loading...
Loading...
Loading...
Loading...
Loading...
Loading...
Loading...
Loading...
Loading...
Loading...
Loading...
Loading...
Loading...
Loading...
Loading...
Loading...
Loading...
Loading...
Loading...
Loading...
Loading...
Loading...
Loading...
Loading...
Loading...
Loading...
Loading...
Loading...
Loading...
Loading...
Loading...
Loading...
Loading...
Loading...
Loading...
Loading...
Loading...
Loading...
Loading...
Loading...
Loading...
Loading...
Loading...
Loading...
Loading...
Loading...
Loading...
Loading...
Loading...
Loading...
This chapter describes the installation process for SysMaster DB 8.
The following steps explain how to configure the control database and install the TPM Agent.
User/ TIP Settings - This section explains how to configure the users and TIP settings for the monitoring database.
TPM Agent installation - This section explains how to install the TPM Agent.
The following steps describe the preparation process before installing SysMaster DB 8.3.
- This section explains the system requirements that must be verified before installation.
- This section explains the environment configuration required before installing SysMaster DB 8.3.
- This section explains the components of the distribution files required for installation.
This section explains how to install SysMasterDB 8.3 in and . The installation process is divided into the following steps for each environment.
Installation and Parameter Configuration - This section explains how to install SysMasterDB 8.3 and configure its parameters.
Startup / Log Check / Shutdown / Initialization - This section explains how to start, check logs, shut down, and initialize the system.
This chapter explains how to use SysMasterDB after connecting to it in the following steps.
- Explains how to log in and select a group.
- Explains groups and permissions.
- Explains how to create users.
To access SysMasterDB 8, the users must first log in via a web browser.
On the login screen, enter the usersr user ID and password, then click the [SIGN IN] button. Upon successful login, the users will be redirected to the group selection screen.
When installing SysMaster DB 8, an account with administrator privileges is created by default. The default administrator account ID and password are both "admin."
If login fails, a "Login Failed" dialog box will appear, prompting the users to verify the usersr ID and password. If login fails five times in a row, a message will appear instructing the users to try again after 10 minutes.
On the group selection screen, users select the group they want to join. If the user is not affiliated with any group, they can log in as Undefined (No Group).
After selecting the desired group, click the "Sign In to Group" button to proceed to the dashboard screen.
The Admin account has the following permissions by default.
Manage members of the assigned group (create, edit, delete users) via the Settings > User menu
All Configurable Privileges for all instances managed by the assigned group
There can be 0 or more Admins in a group.
Common User is the basic permission available from SysmasterDB.
Users are assigned permissions (Configurable Privileges) by Super Admin or Admin.
If no group is currently assigned, login is possible as "Undefined," but after login, access to all pages except "My Account" is restricted.
The users can perform the following actions using the Profile feature.
My Account Settings
Change Theme (Light/Dark)
The users can download the manual in PDF format by clicking the button on the right side of the GNB.
In the All Session Flow screen, the users can view the total number of sessions for each DB user in a graph, excluding users from the same DB. At this time, the users can select the chart interval (Interval) and aggregation method (Aggregation) from the dropdown menu to view the data.
This section describes Main Monitoring, which allows the users to monitor DB session status, CPU and memory usage of DB machines, and various metrics of DB instances through charts.
Session MonitoringServer MonitoringInstance MonitoringThis section describes Usage Monitoring, which allows the users to monitor the real-time usage status of Tablespace, File, Temp space, and Undo space.
Tablespace UsageFile UsageTemp UsageUndo UsageRegistering an instance - Explains how to register a monitoring database.
Creating a group - Explains how to create a group.
The deployment files for SysMasterDB 8.3 are structured as follows depending on the installation environment.
The TPM Agent deployment files are structured as follows.
The Java TPM Agent distribution files are structured as follows.
sysmaster-db
sysmaster-db-{version}.tar
meta.conf
repo.conf
docker-compose.yml
.env
sysmaster-db-patch-{version}.tar
patchsysmaster-db-{version}.tar
kubernetes
+-- init
|-- 0.namespace.yaml
|-- configmap.yaml
|-- pvc.yaml
|-- service.yaml
+-- db
|-- metadb-deployment.yaml
|-- repodb-deployment.yaml
+-- kafka
|-- kafka.yaml
+-- sysmaster
|-- analyzer-deployment.yaml
|-- client-deployment.yaml
|-- collector-deployment.yaml
|-- sdm-deployment.yaml
|-- tibero-master-deployment.yaml
sysmaster-db-patch-{version}.tar
patchlibavrocpp.so.1.11.0
libboost_atomic.so.1.78.0
libboost_filesystem.so.1.78.0
libboost_iostreams.so.1.78.0
libboost_program_options.so.1.78.0
libboost_regex.so.1.78.0
libboost_system.so.1.78.0
libboost_thread.so.1.78.0
libboost_unit_test_framework.so.1.78.0
libbz2.so.1
set.sh
tpmagentjdk8
+-- aix7
|-- ibm-semeru-open-jdk_ppc64_aix_8u382b05_openj9-0.40.0.tar
lib
+-- aix7
|-- libJNITpmStat.so
+-- centos7
|-- libJNITpmStat.so
app.jar
application.yml
set.sh
tpmctl.shThe users can set the group to monitor in each menu of System Master.
Logout
Note
Users can log out by closing the browser or through the Profile in Global Navigation Bar (GNB).
If the user does not log out separately, the user session will be maintained for up to one year from the time of login.
This section describes how to start, check logs, stop, and initialize SysMaster DB 8.3 in Docker-compose and Podman-compose environments.
export SYSMASTERDB_HOME={SysMasterDB_Home_Path}{SysMasterDB_Home_Path}
The directory path where the docker-compose.yml file is located.
export PATH=$PATH:$SYSMASTERDB_HOMEsysmaster-db upAfter booting is complete, the users can log in and use the program. Boot completion can be confirmed via the SDM log with the following log:
The users can specify the path where logs will be stored by configuring the log-related parameters in the .env file. The default log path is ./logs, so a logs folder is automatically created in the directory where the docker-compose.yml file is located, and the users can view the log files there.
With the environment variables and PATH set for SysMaster DB 8.3 startup, executing the following command will remove all services and shut down SysMaster DB 8.3. Note that even after shutting down SysMaster DB 8.3, the files created in METADB_PATH and REPODB_PATH will be retained, so the users can use SysMaster DB 8.3 as before after restarting it.
After deleting the METADB_PATH and REPODB_PATH directories, restarting SysMaster DB 8 will restore it to its initial installation state. However, any previously saved data will not be available.
The following ports used by SysMaster DB 8 must be allowed for external access.
List of ports that must be allowed on the SysMaster DB server
List of ports that must be allowed on the control database server
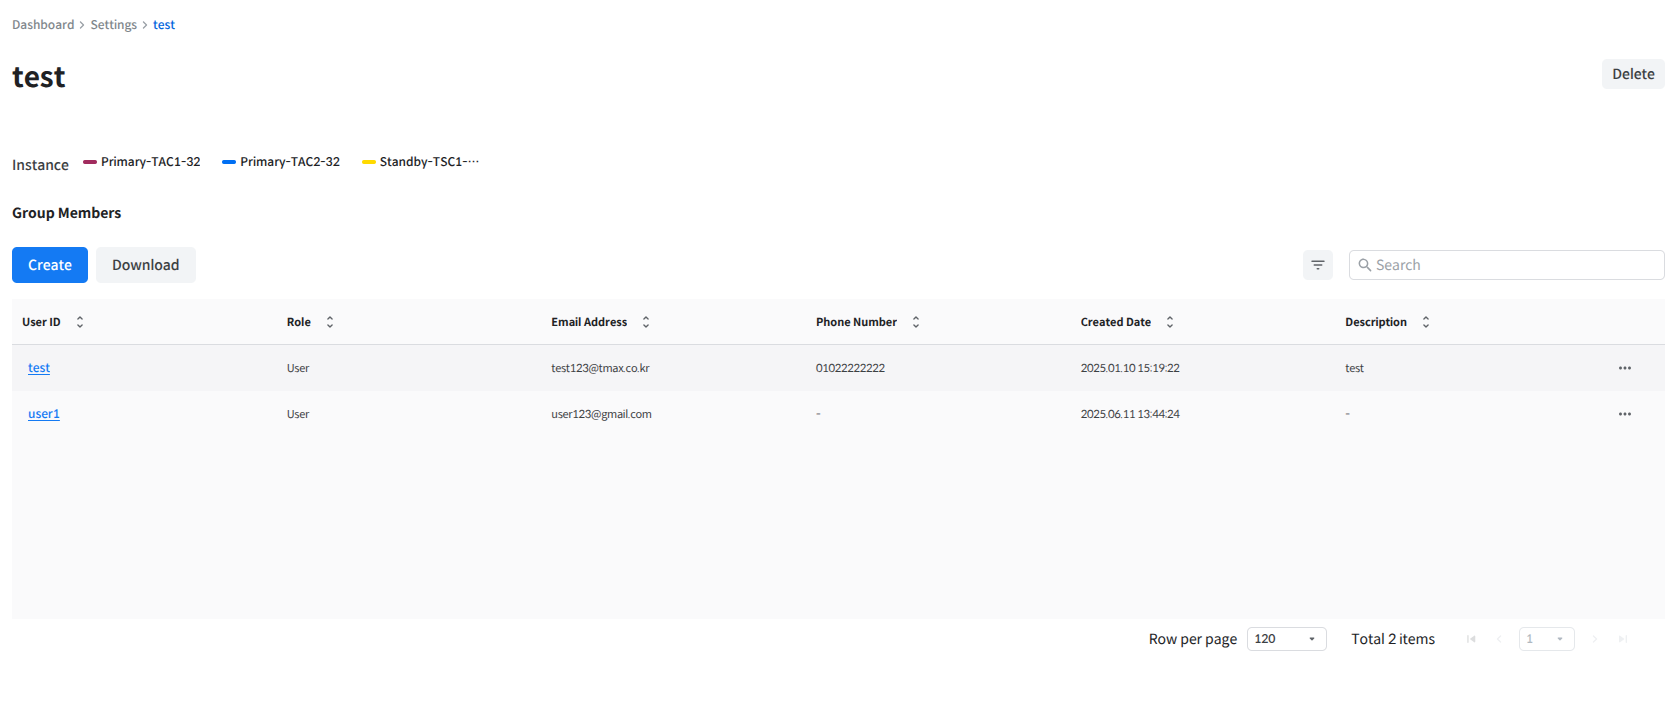
All users can belong to one or more groups. When a user belongs to a group, they are assigned the roles of that group.
ex) admin, userA user can have one role per group, and if they belong to multiple groups, they can have different roles for each group.
Groups are assigned instances. Group members can be assigned permissions (Configurable Privileges) for the instances assigned to their group.
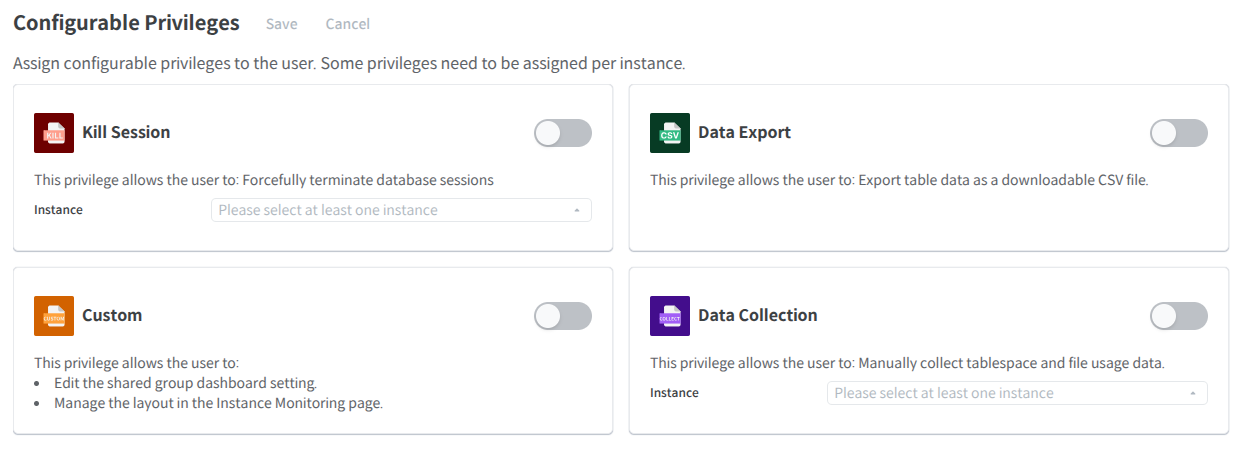
Configurable privileges refer to individual user permissions.
They exist by function and instance and can be directly modified by admins or super admins.
The default value is "no permissions."
Privileges explicitly specified for an instance can only be used in that instance, while privileges not explicitly specified for an instance can be used on all pages regardless of the instance.
When changes are made, the "Save" button becomes active, and the users must click "Save" to save the changes. Clicking "Cancel" will revert to the previous settings.
The following is a description of each privilege.
After logging in, click the import button on the Dashboard, which is the first screen, to register an instance.
Instance Alias
Instance name (information displayed on the card)
The newly registered instance will not be reflected on the screen immediately. After assigning the instance to a group, monitoring is possible from the Dashboard.
Click the icon in the upper-right corner of GNB to access settings.
In the Settings menu, click the All Groups menu in the top-left corner, then click the Create button at the bottom to create a new group. This will allow the users to create a group.
The "All Groups" menu is only available to super admins.
The required items when creating a group are as follows.
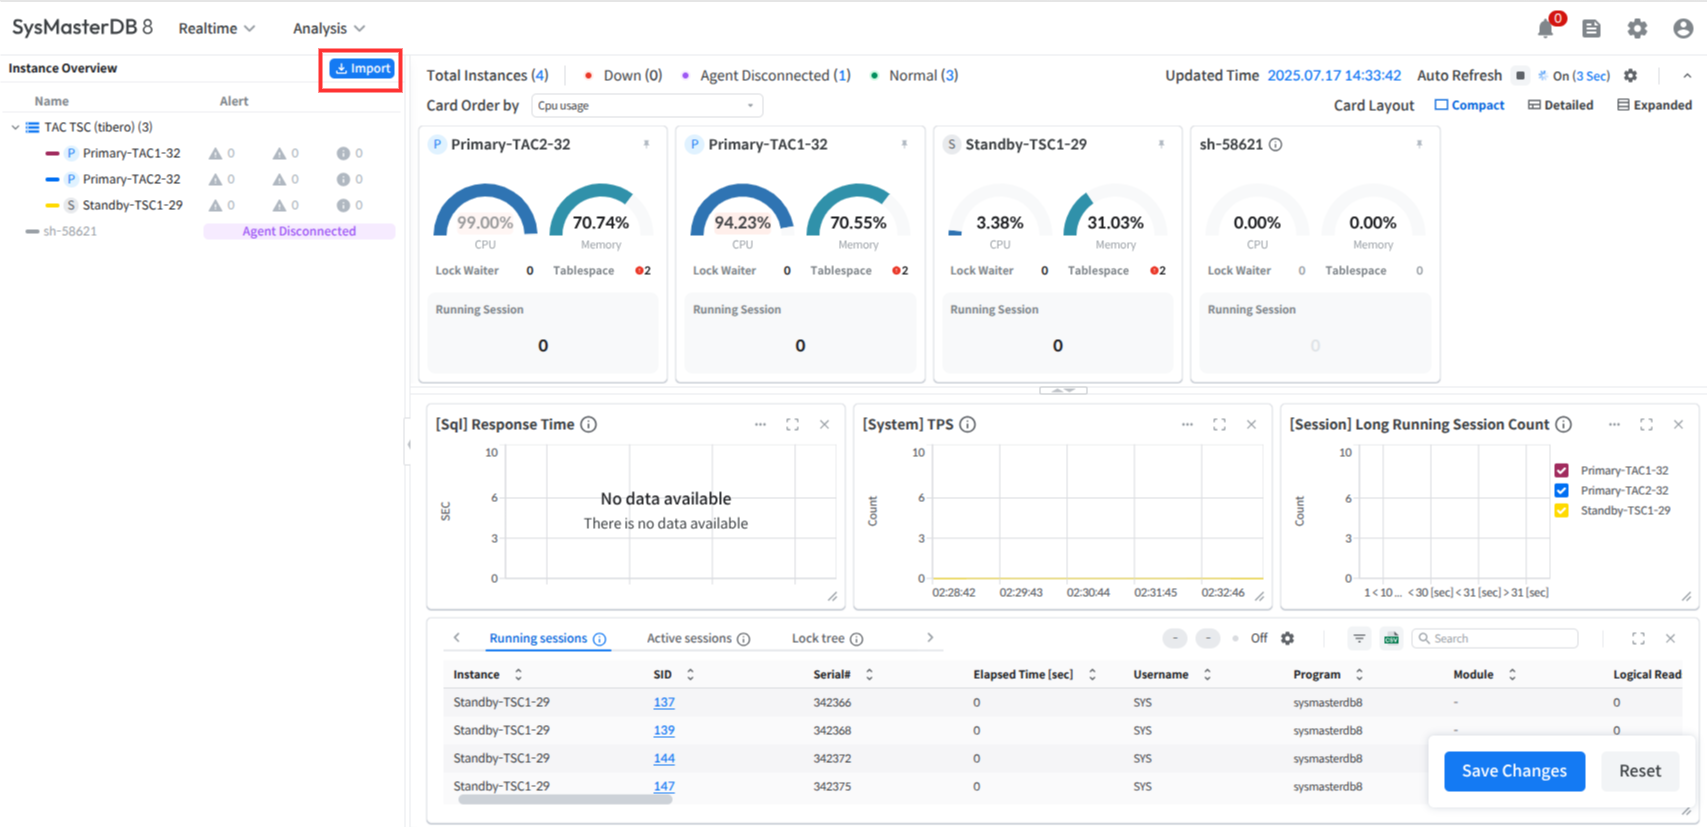
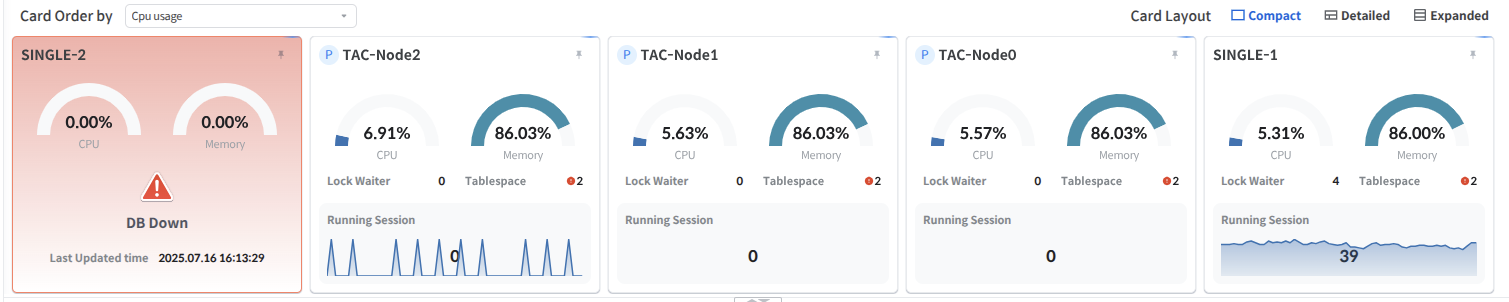
The users can view the status of the currently monitored instances and key monitoring data in a card view format.
The Card View refreshes every 3 seconds by default and displays cards sorted according to the Card Order By setting. (Refer to Card Sorting Criteria)
The users can switch between Compact / Detailed and Extended layout through the card layout button in the upper-left corner.
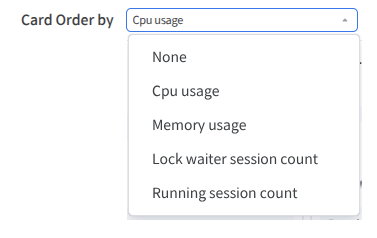
Sort the Card View by CPU Usage, Memory Usage, Lock Session Waiter Count, or Running Session Count.
When Refresh is performed, Card View is sorted according to the specified criteria. If None is selected, the cards are sorted in the order of the Instance Overview.
Click the pin button in the upper left corner to pin a card to the upper left corner.
If multiple card views are pinned, they will be fixed in the order they were pinned.
Displays the Updated Time of the Card View.
Click Compact / Detailed / Expanded on the right side of Card layout to change the Card View layout.
Card View selection feature
Click Card View to highlight a specific instance, similar to clicking an instance in Instance Overview.
When an instance is highlighted, the Custom Area at the bottom displays only the data of the highlighted instance instead of the metrics of all instances.
Super Admin refers to the highest-level administrator who can perform all functions of SysmasterDB.
The Super Admin account has the following permissions by default.
Register, modify, and delete instances in the Dashboard
Create, modify, and delete groups via the Settings > All Groups menu
Create, modify, and delete all users registered in SysMasterDB via the Settings > All Users menu
There can only be one Super Admin in SysmasterDB.
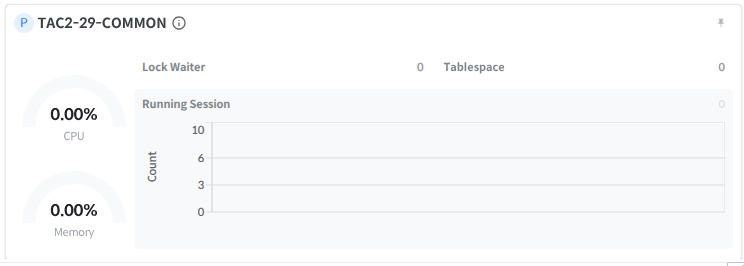
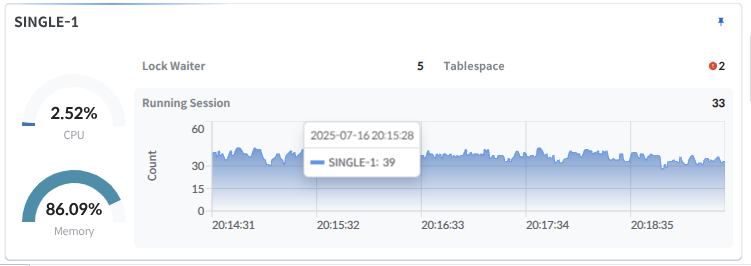
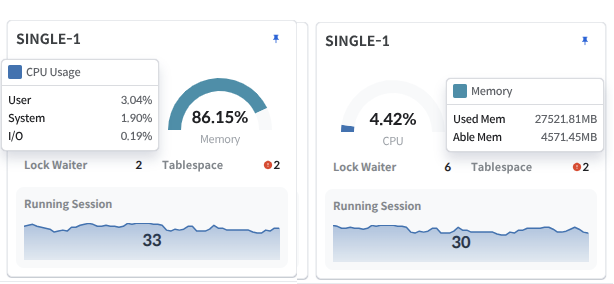
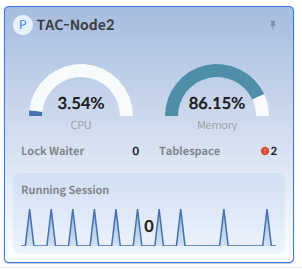
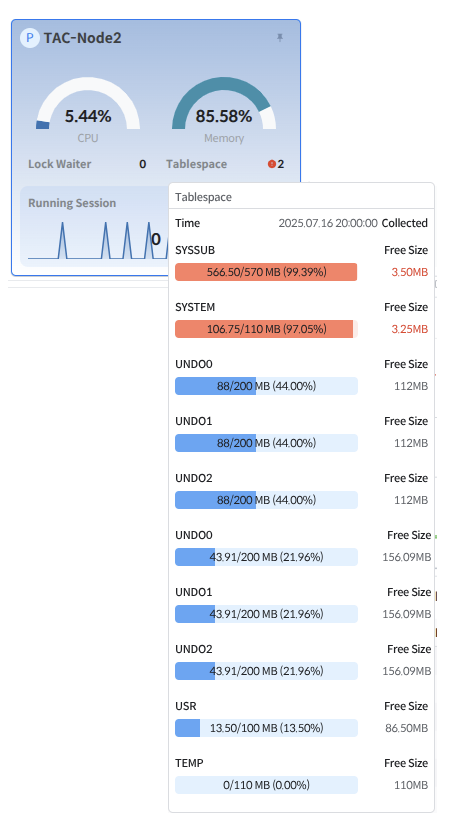
Hover the mouse over the CPU/Memory pie chart to view detailed information.
Lock Waiter: Displays the number of sessions waiting for a lock.
Tablespace: Displays the number of tablespaces with usage exceeding 90%. When hovering over the mouse, displays the usage status of the top 10 tablespaces in descending order.
Running Session: Displays the trend of Running Sessions over the past 5 minutes in an Area chart and shows the current number of Running Sessions in the upper-right corner.
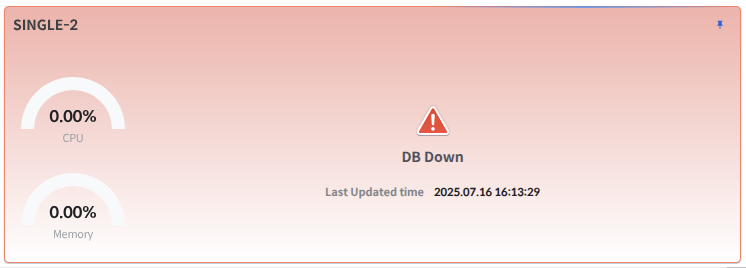
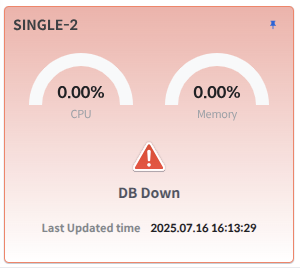
If the monitored instance DB is in a down state, displays the time when it was last in a normal state.
When the Agent is disconnected, it is displayed as above and sorted at the end of the card view.
This chapter describes Realtime Monitoring, which provides real-time status monitoring of the database.
Main Monitoring - View real-time metrics such as DB session status, CPU and memory usage of DB machines, etc.
Usage Monitoring - Real-time status of tablespaces, files, UNDO, and TEMP spaces can be checked.
- The users can identify lock status between DB sessions and analyze issues.
- Monitor TSC configuration, network status, and recovery status in real time.
Hover the mouse over the CPU/Memory pie chart to view detailed information.
Lock Waiter: Displays the number of sessions waiting for a lock.
Tablespace: Displays the number of tablespaces with usage exceeding 90%. A scrollable table at the bottom shows the current usage status of tablespaces.
Running Session: Displays the trend of Running Sessions over the past 5 minutes in an Area chart and shows the current number of Running Sessions in the upper-right corner.
If the monitored instance DB is in a down state, displays the time when it was last in a normal state.
When the Agent is disconnected, it is displayed as above and sorted at the end of the card view.
The users can monitor detailed information such as the current SQL being executed and wait events for a specific session. Click the SID of the session the users want to view in detail in the session list to open the Session Details page.
These are the items displayed in a single row on the Session Monitoring page. Like the Session Monitoring screen, it provides refresh, auto refresh, and kill session functions.
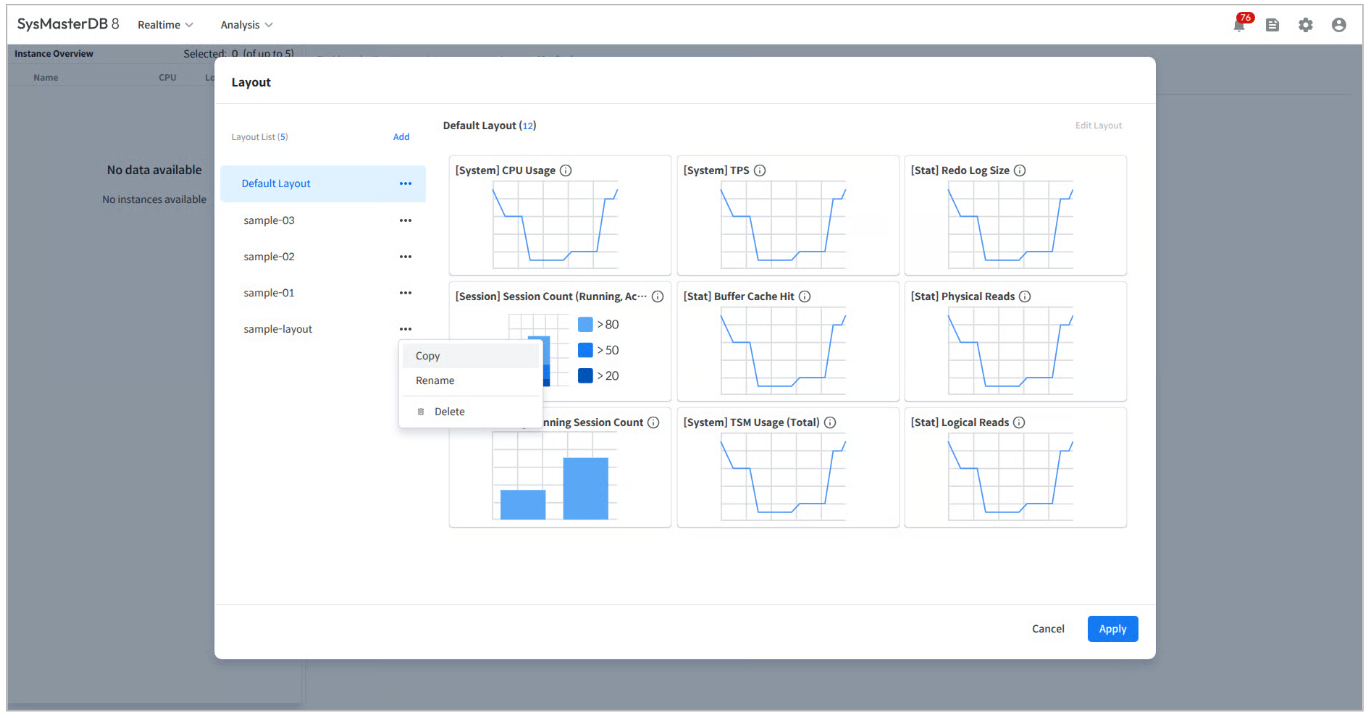
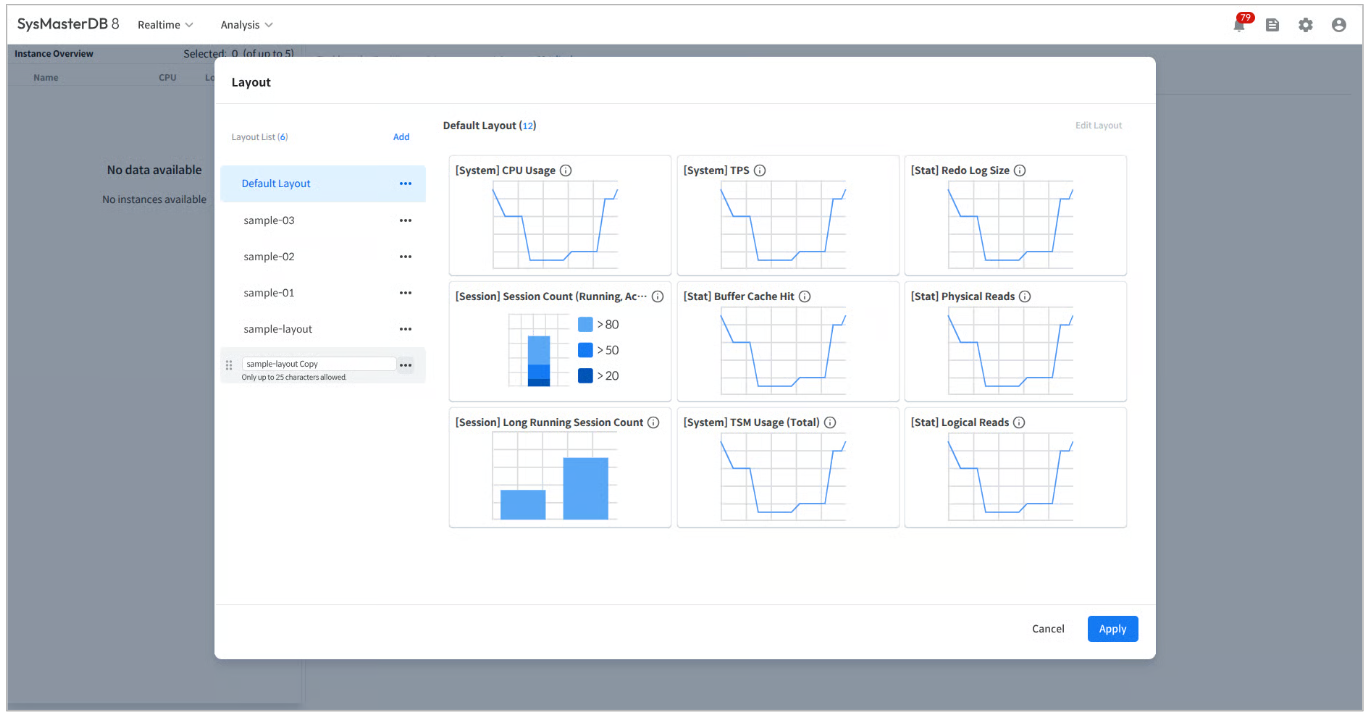
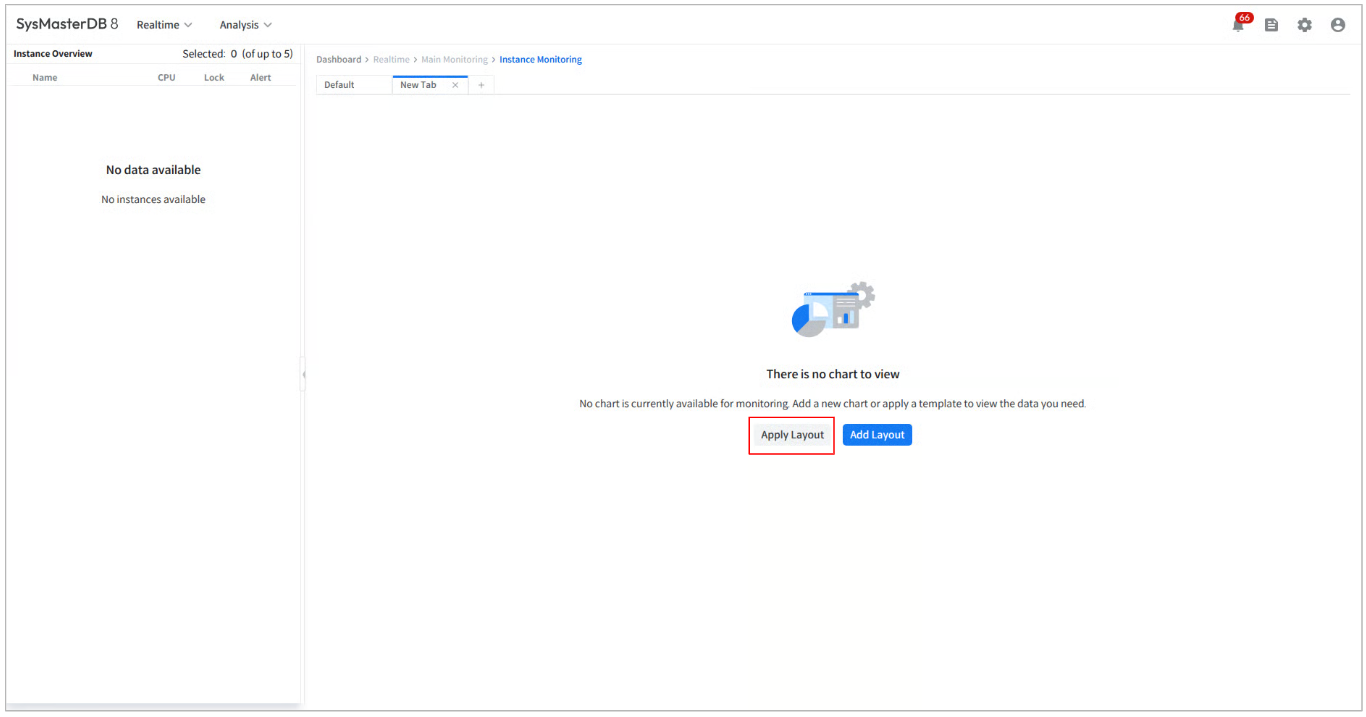
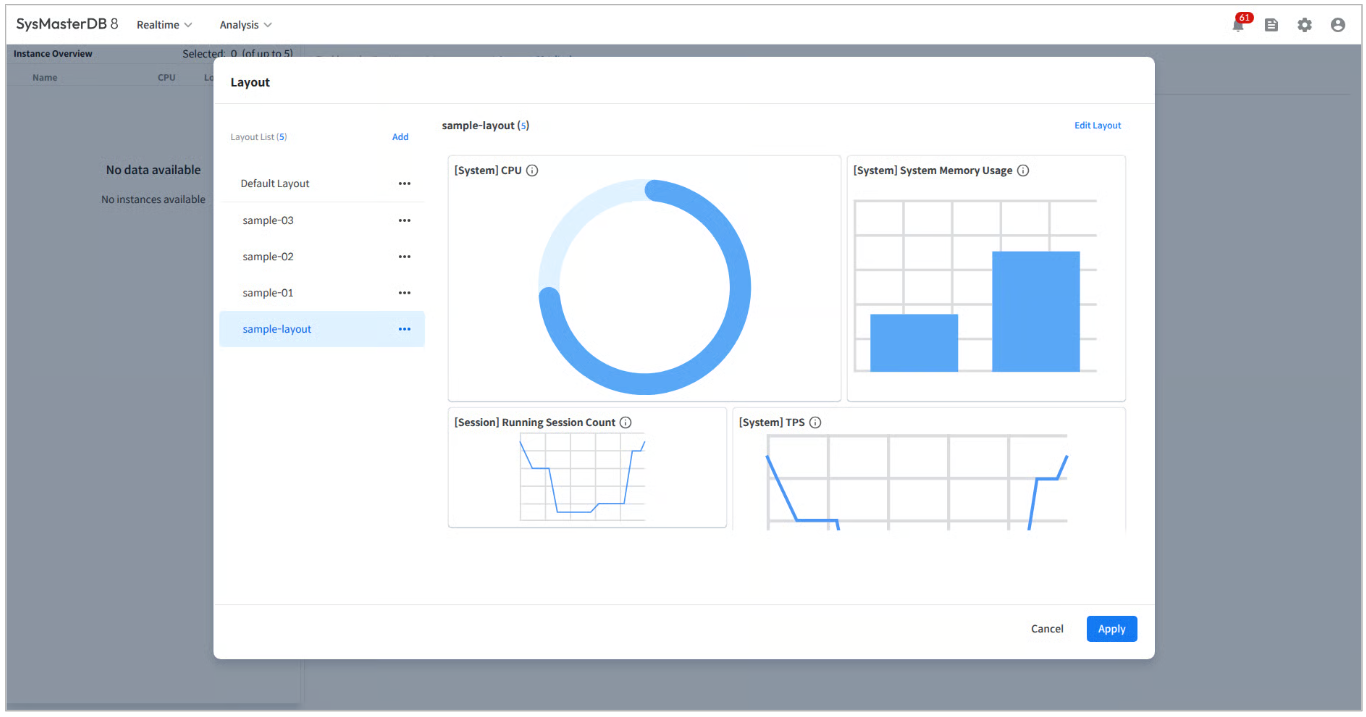
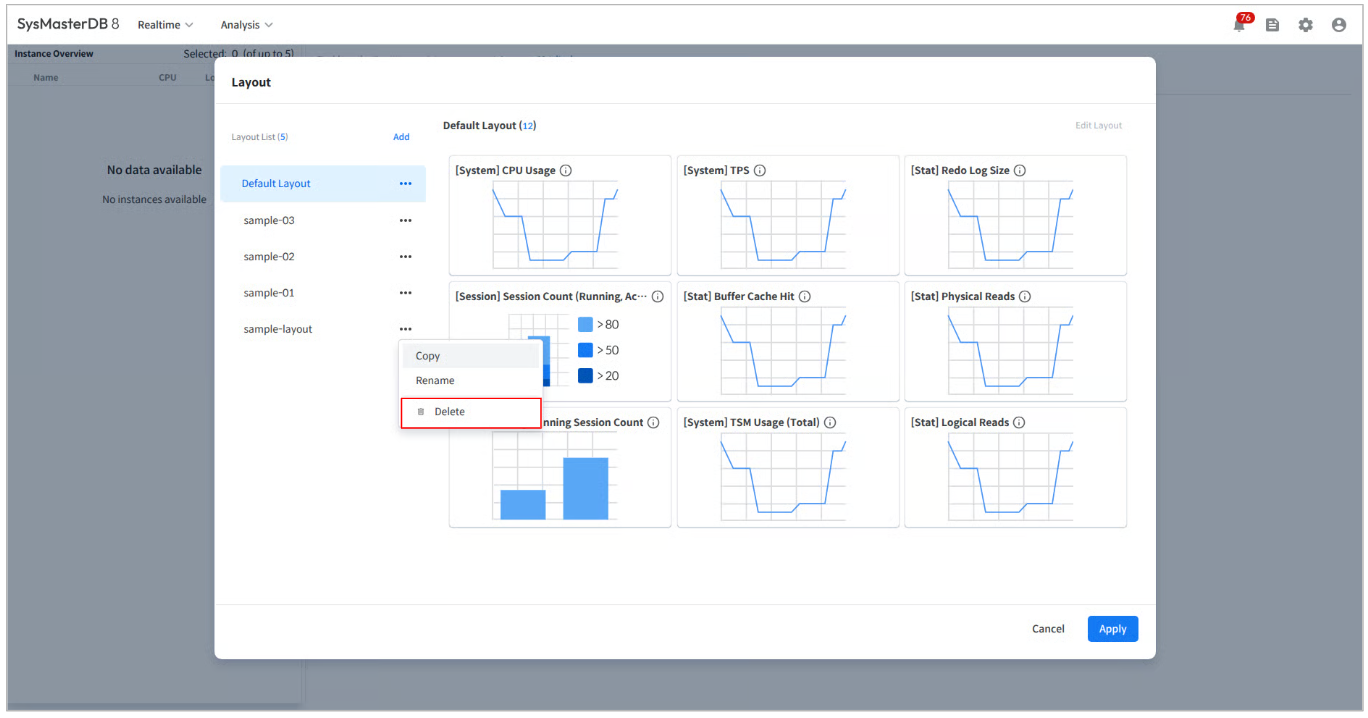
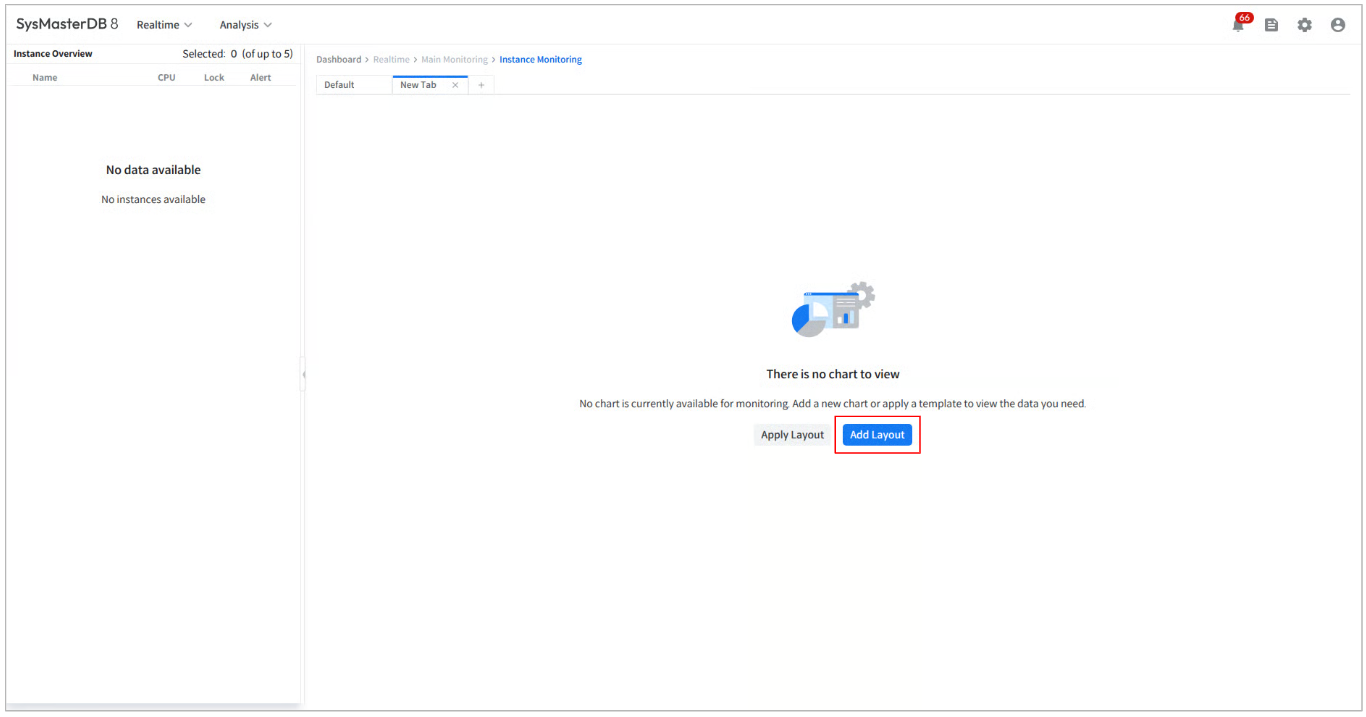
Click the [Add Layout] button in [New Tab] to view the existing Layout list and select the desired Layout to apply.
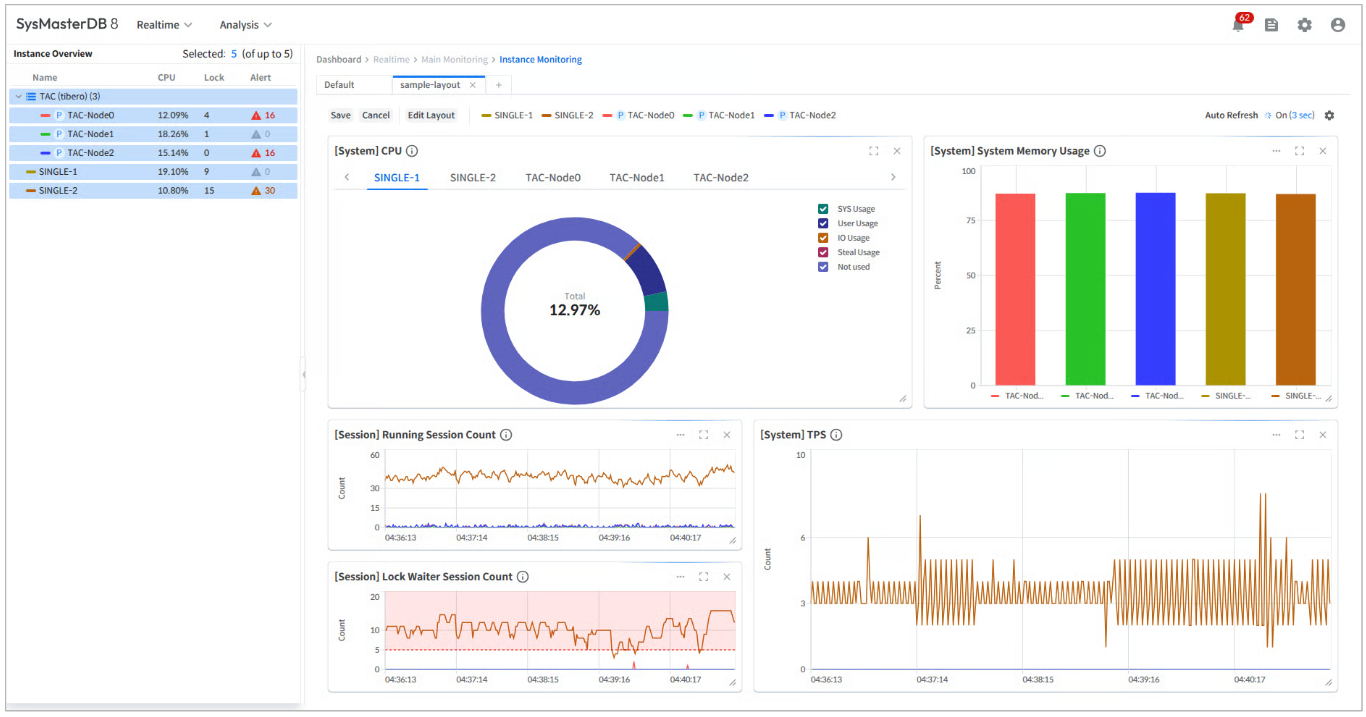
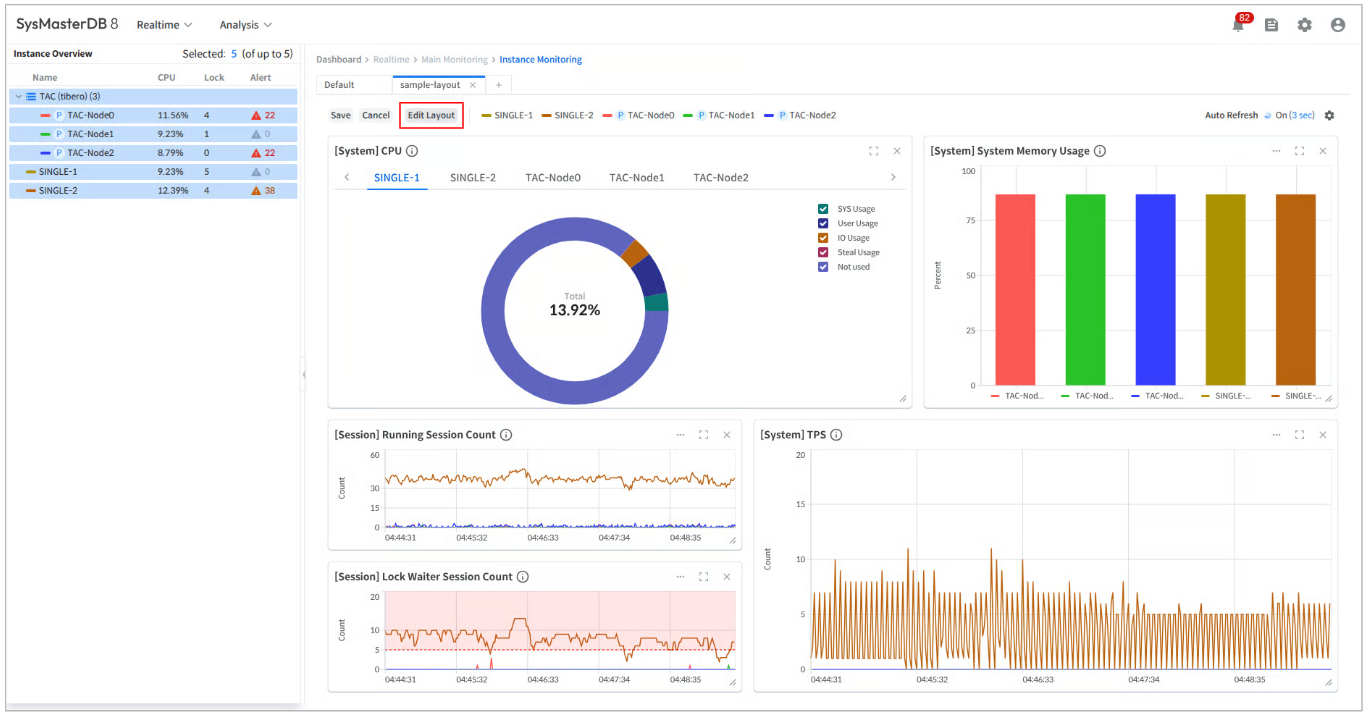
The following are examples of the Layout list modal and the screen after applying the selected modal.
The Period Selector in the All Session Flow page includes the Chart Interval feature. While the Period Selector in the common functions dynamically determines the Chart Interval based on the query period, the All Session Flow page allows users to specify the Chart Interval.
Chart Interval consists of sec, min, hour, and day, and can be selected if the selected Period includes the time that can be expressed by Chart Interval.
Note
The following are examples of time intervals that can be expressed using Chart Interval.
When the Period is 04-22 00:00 ~ 04-22 10:00, the users can select sec, min, hour, and day.
When the Period is 04-22 01:00 to 04-22 10:00, since 00:00 is not included, DAY cannot be expressed, so sec, min, and hour can be selected.
Provides a comparison analysis function for SQL plans that have been changed during the specified period.
Provides session connection trends for each monitoring DB and the current status of session connections at each point in time.
Lists SQL statements that generated hard parses during the specified period.
The users can view the history of alerts generated based on user-defined alerts and system alert rules.
The users can view the Invalid Objects Count data and detailed information about invalid objects.
Click the [Analysis] > [History Analysis] > [Changed Plan Analysis] menu in the global navigation bar to open the Changed Plan Analysis screen.
The Changed Plan Analysis screen provides charts for comparing and analyzing SQL plans that have been changed during the specified period.
Click the [Analysis] > [History Analysis] > [All Session Flow] menu in the global navigation bar to open the All Session Flow screen.
The All Session Flow screen displays the number of sessions by DB user who accessed the system during the specified period in a graph. The users can check how many sessions a user had at a specific point in time and view which sessions were active at the selected time.
Click [Analysis] > [Performance Analysis] > [Heatmap Trend] in the global navigation bar to open the Heatmap Trend screen.
The Heatmap Trend screen displays an overview of resource usage for the selected instance. During the specified time period, resource usage is visualized by time and date, allowing the users to quickly grasp the overall usage trends. Additionally, a bar graph showing minute-by-minute usage for the selected time period provides a detailed view of the overall usage flow.
Note
The searchable interval for the Heatmap is less than 10 days.
The New Plan List screen allows the users to view the history of new plans.
The following is a description of the items provided on the New Plan List screen.
The users can view the minute-by-minute chart for the selected hour in the Daily Hourly Chart. This chart is located below the Daily Hourly Chart.
Clicking the Minute Chart bar allows the users to navigate to the desired menu.
The descriptions for each button are as follows.
The Plan History Comparison screen allows the users to compare plans for the same SQL with different TimeStamps and Child Numbers. The comparison of plans can be viewed in both Plan Tree and Plan Text formats.
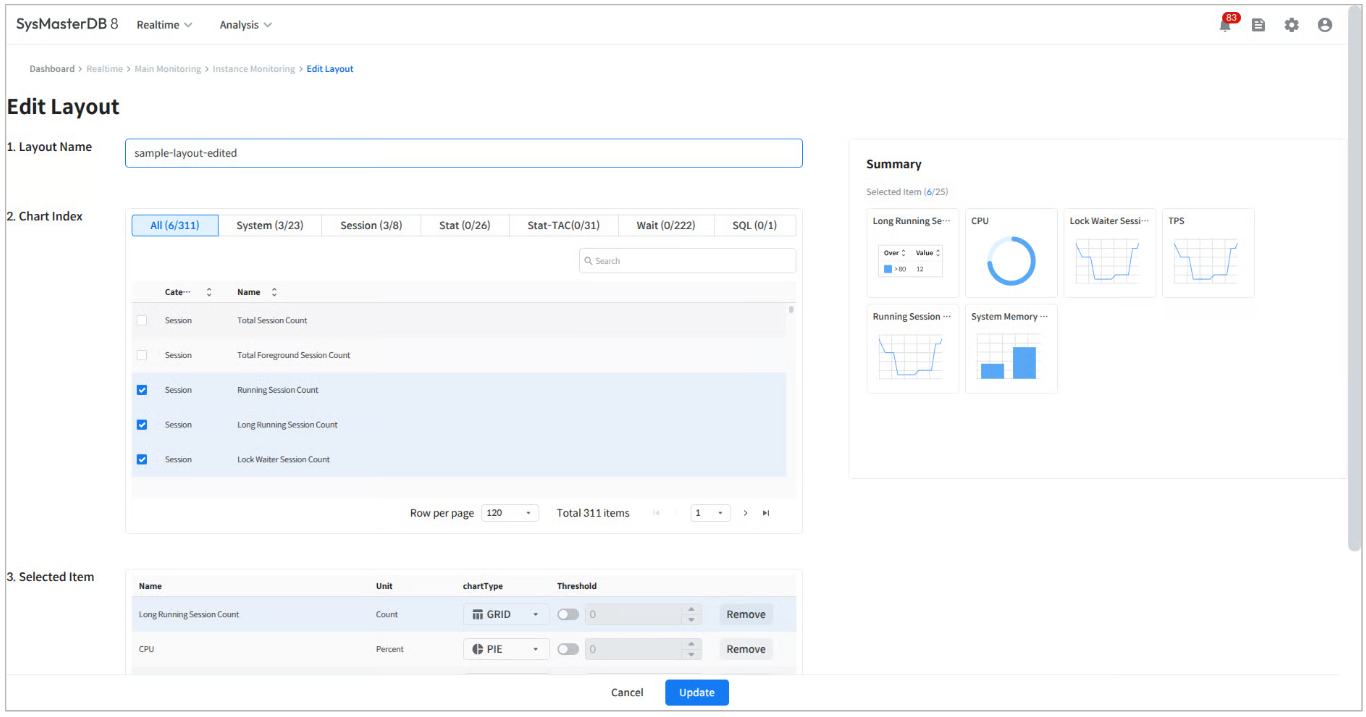
Click the [Edit Layout] button to modify the existing Layout settings.
For detailed explanations of each item on the Edit Layout page, refer to Add Layout.
Note
For changes related to chart placement and detailed settings within the Layout, refer to the [Save Layout] option in .
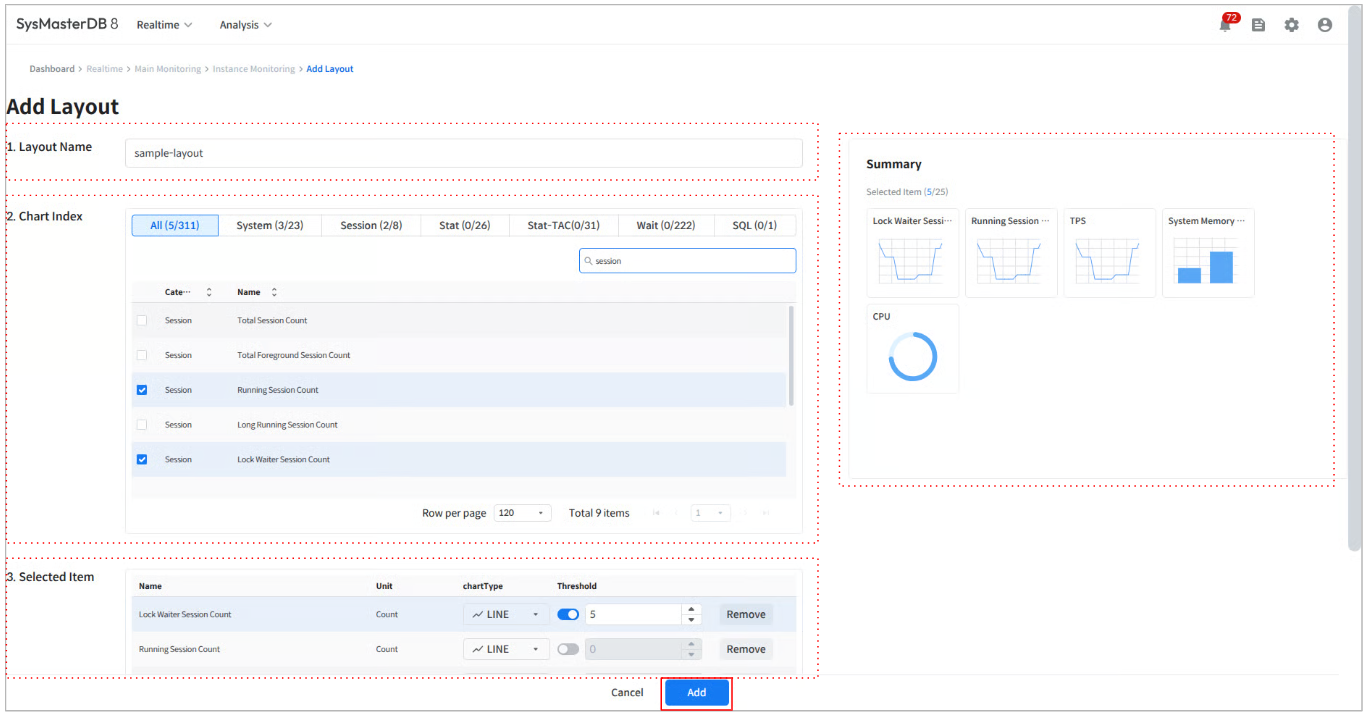
Click the [Add Layout] button in the [New Tab] to create a new layout.
Layout creation proceeds as follows.
Layout Name
Enter the layout name. This name will be displayed on the Instance Monitoring page.
Chart Index
Select the metrics the users want to monitor in real time. Refer to the appendix for a list of monitoring metrics available in Instance Monitoring.
Selected Item
Review the list of selected metrics and configure the chart options for each metric.
Summary
The users can view a layout example reflecting the list of metrics selected by the user.
Add
Click the Add button to create a layout defined by the user and apply it to the Layout Tab.
About the Guide
Issued date: 2025.08.14 Software version: SysMasterDB 8.3 Guide version: v1.0
This manual describes the process of installing SysMasterDB 8.3 on a system. It is intended for system administrators and DBAs who want to install SysMasterDB 8.3.
Database
This chapter describes the Dashboard, which allows the users to monitor all monitoring database instances within the selected group.
It provides real-time status information and metrics for each monitored instance.
The users can set the Auto Refresh interval and pause by clicking the gear icon in the upper-right corner.
The Dashboard consists of the following main sections.
The Alert Event section displays a list of alerts that have not yet been confirmed. Alerts are divided into two categories: User-created, which are generated based on criteria set by the user, and System, which are automatically set and occur across all instances.
To remove an Alert Event, the users must either confirm each Alert individually or click the Confirm All button in the upper-right corner.
Group: The name of the group to which the Alert is registered
Hover the mouse over the CPU/Memory pie chart to view detailed information.
Lock Waiter: Displays the number of sessions waiting for a lock.
Super Admin and Admin can create users in .
Performance Analysis allows the users to check various performance-related metrics.
After checking the long-term trend using the Overall menu, the users can use the Time Slice feature to view all indicator information at a specific point in time.
The users can set the viewing period for each submenu of Analysis. Click the Time Slice button at the top of the screen to move to the Time Slice creation window.
Select the time period for the Time Slice.
The Instance Overview area of the Instance Monitoring page displays a summary of the current selected group's instance list and status information.
The Instance Overview area is provided as a side panel on the left side of the Instance Monitoring page.
This area displays the list of instances registered in the currently selected group, along with summary information about the status of each instance.
Users can select and monitor up to 5 instances simultaneously in a single layout.
The instance status information available through the Instance Overview area is as follows.
Click [Realtime] > [Usage Monitoring] > [Temp Usage] in the global navigation bar to open the Temp Usage page.
The Temp Usage page displays session temporary usage information. The users can monitor sessions that are using excessive temporary tablespace due to inefficient execution plans or poorly written SQL statements.
The following is a description of the items provided on the Session Temp Usage page.
Provides a chart broken down by time units for the selected day. The users can use the [OS], [STAT], [WAIT(TIME)], [WAIT(COUNT)], and [SESSIONS] buttons at the top of the Heatmap Trend screen to view an overview of each metric's usage.
Displays a time-based chart showing the usage of OS-related items (e.g., 'CPU Idle', 'CPU Sys', 'Memory Usage', etc.).
The users can change the resource to view by using the combo box on the right side of the metric selection button area.
Click [Realtime] > [Usage Monitoring] > [Undo Usage] in the global navigation bar to open the Undo Usage screen.
The Undo Usage page displays Undo usage information. The users can view information about sessions that have not yet committed or rolled back the current transaction.
The following is a description of the items provided on the Session Undo Usage page.
Click [Analysis] > [History Analysis] > [Alert Event Analysis] in the global navigation bar to open the Alert Analysis page.
The Alert Event Analysis page displays the history of alerts triggered by notification and system notification rules set by users of the SysMaster DB 8 product. The users can also check whether the alerts have been acknowledged.
The users can view user-defined notification occurrence information in a chart by setting a time range.
The users can set a time range to view user-defined notification occurrence information in a chart.
This section describes the common features of monitoring metric charts provided in the Layout tab area of the Instance Monitoring page.
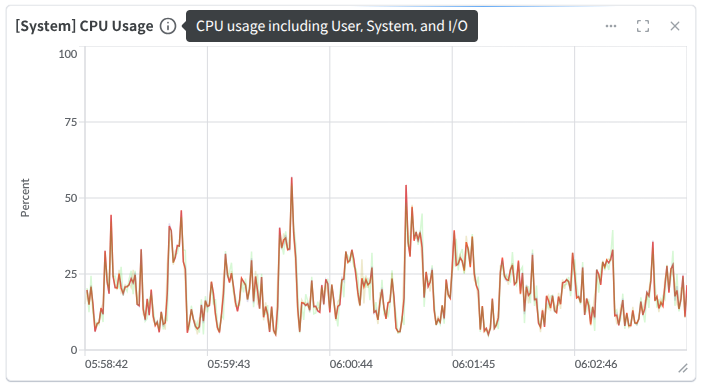
When the users hover the mouse pointer over the info icon to the right of the metric name in the upper-left corner of the chart, the users can view the description for that metric.
Clicking the More icon in the upper-right corner of the chart displays a list of additional features supported for each chart.
Additional features vary depending on the , and descriptions of chart-specific additional features can be found in the chart-type documentation.
Click [Realtime] > [Usage Monitoring] > [File Usage] in the global navigation bar to open the File Usage page.
The File Usage page displays information about data file usage. File Usage is collected every hour to minimize the load on the monitoring database. Clicking the [Collect] button in the upper-right corner collects and displays the latest File Usage information.
The users can view the data file I/O usage information for the tablespace of the monitored database.
This area shows the current status of alerts for monitored instances. It displays the number of alerts for each alert level (Error, Warning, Info). Click the button to go to the alert event history for the corresponding instance.
Both User-Created Alerts and System Alerts can be viewed. The users can check the time the alert occurred, the alert name, the alert level, the instance where the alert occurred, whether it was confirmed, and the user comments made when the alert was reviewed.
The users can change the instance and filter conditions to view Alerts from other instances or specific time periods.
The Total Session Info screen displays information about the session selected in All Session Count.
The following is a description of the items provided on the Total Session Info screen.
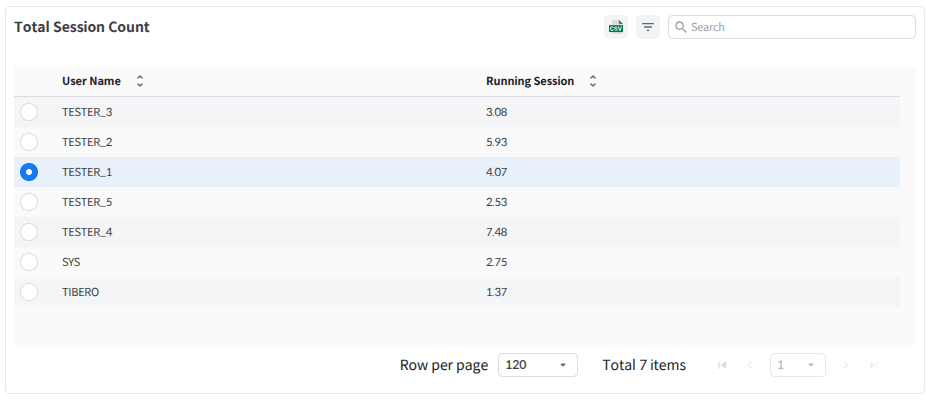
The Total Session Count screen displays the total number of sessions selected in the All Session Count screen.
The following is a description of the items provided on the Total Session Count screen.
Click the [Analysis] > [History Analysis] > [Search SQL Text] menu in the global navigation bar to open the Search SQL Text screen. The Search SQL Text screen displays a list of SQL statements for the specified period.
Double-clicking a specific column in the SQL list on the Search SQL Text screen opens the screen, where the users can view detailed information about the corresponding SQL.
Usage Analysis allows the users to view changes during the specified period.
The users can view the amount of change in the size of each tablespace name during the specified period.
The users can view changes in the size of filesystems mounted on the server by filesystem name during the specified period.
The SQL Text screen displays the entire syntax for the SQL statement selected in the New Plan List.
CLIENT_PORT
Port for connecting to the SysMaster DB UI from a browser
8
User PC running the browser to access the SysMaster DB UI
COLLECTOR_PORT
The port to which the TPM Agent connects to send collected information to the SysMaster DB
8
Monitoring database server
REPODB_PORT
Port used to connect to REPODB (Used for users to directly query REPODB; unrelated to SysMaster DB operations)
15432
User PC connecting to REPODB
METADB_PORT
Port for connecting to METADB (For users to directly query METADB; unrelated to SysMaster DB operations)
25432
User PC connecting to METADB
Tibero listener port
Port used to connect to the monitoring database from the SysMaster DB server
8629
SysMaster DB server
Note
The initial account information is ID: admin, Password: admin.
Data Collection
The users will have permission to collect information about the selected instance from Table Space Usage and File Usage.
Kill Session
The users will have the permission to forcefully terminate the session of the selected instance.
Data Export
The users will have the permission to download CSV files.
Custom
The users will have the permission to modify the layout in the Dashboard and create, modify, or delete layout in Instance Monitoring.



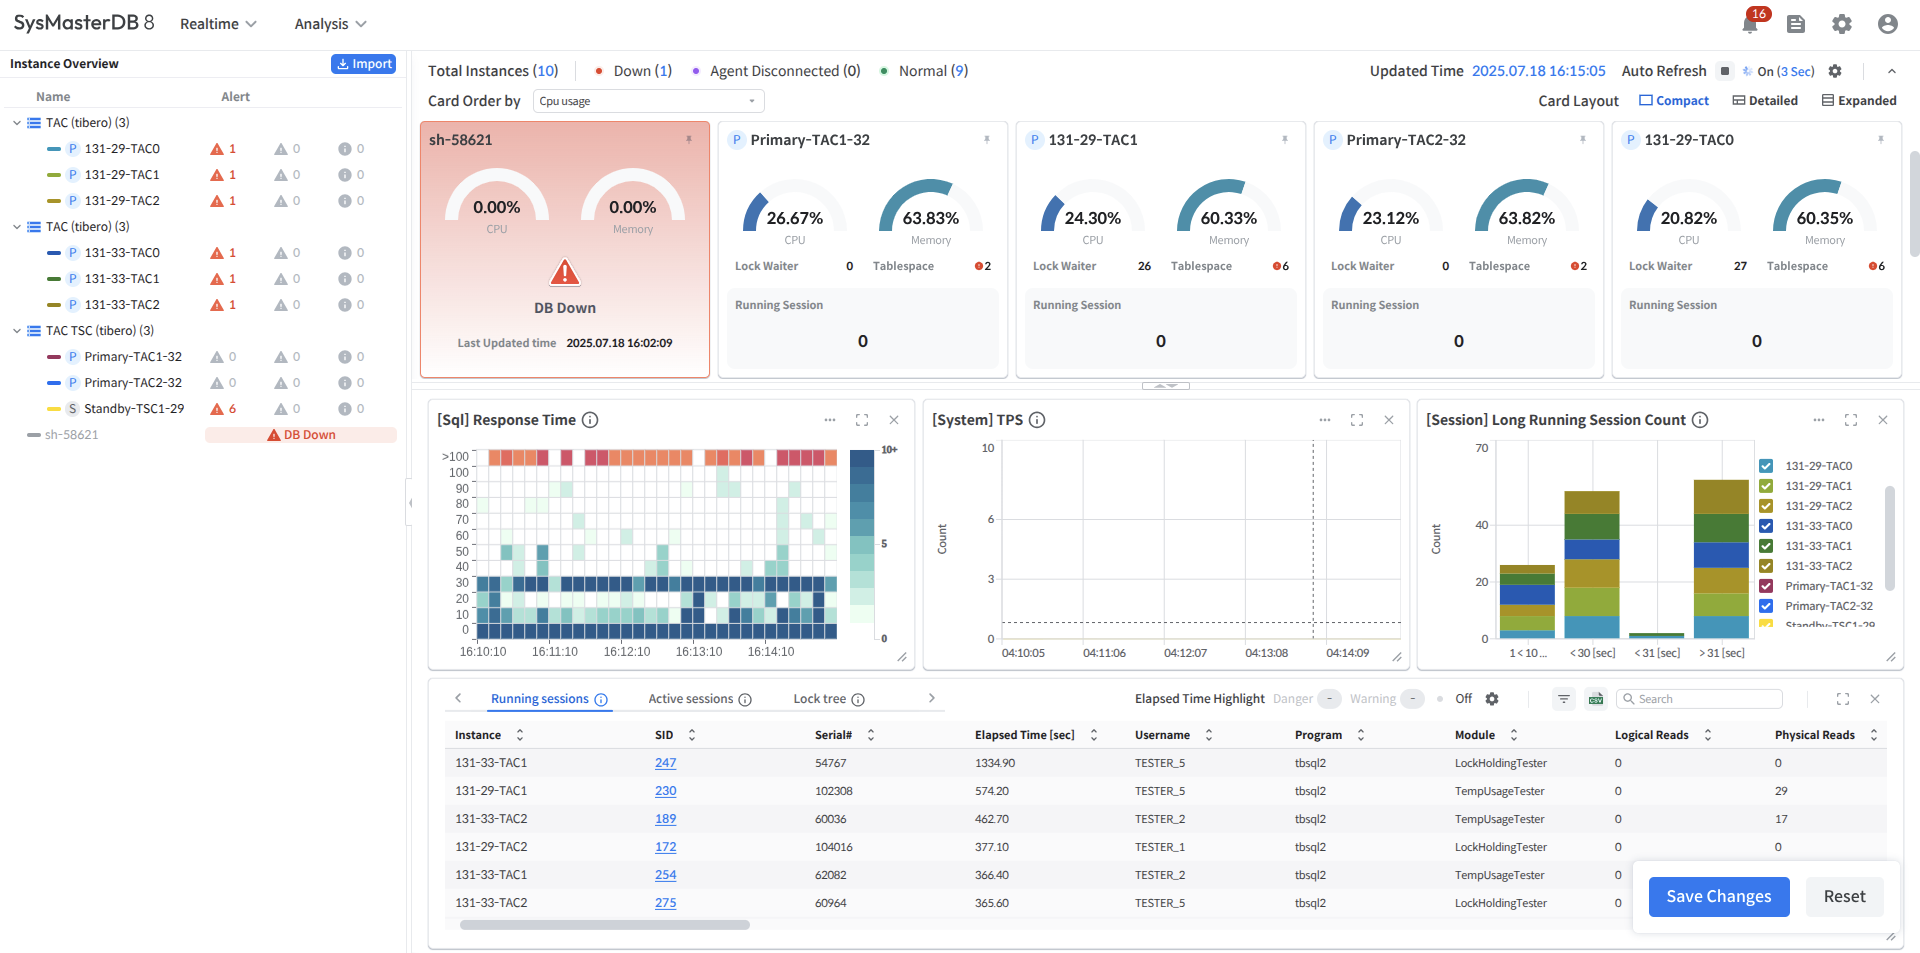
Provides main menus and global navigation functions.
Area for checking the status of DB instances and the status of alerts generated by instances
Provides key metrics such as the status and CPU/running sessions of each instance in a card view format.
Provides charts and tables with more detailed real-time performance metrics for instances within a group.
Layout Split
Button to adjust the size ratio between the Custom Area and Card View Area
Drag or click to set the Card View : Custom Area ratio to 1:2 / 2:1 / 3:0

User Name
User name
Running Session
Running Session number
The users can check the change in Temp size by time unit during the specified period.
The users can view the change in Undo size by time unit during the specified period.
Note
For the Client module, logs are not saved to a file separately, so the users must check the logs output using commands such as docker compose logs .
Started SdmApplication in ... seconds (JVM running for ...)sysmaster-db downRole
Specify the role of the user in the group.
Description
Enter a description of the group.
Group Name
Specify the name of the group to be created.
Instance
Specify the instance to be assigned to the group.
Member&Name
eSpecify the users to be added to the group based on their IDs.
RDBMS
OSs and system environments
Unix (including Linux)
These are the copyright notices for SysMasterDB manual.
Tmax Tower, 45 Jeongjail-ro, Bundang-gu, Seongnam-si, Gyeonggi-do, Republic of Korea
Tel : +82-1544-8629
E-Mail : gitbook@tibero.com
The contents of this software (SysMasterDB 8®) manual and the program are protected by copyright laws and international convention. The contents of this manual and the programs described herein are available only under a license agreement with TmaxTibero Co., Ltd. and may be distributed or reproduced only within the scope of the license agreement.
No part of this document may be transmitted, copied, deployed, or reproduced in any form or by any means, electronic, mechanical, or optical, without the prior written consent of TmaxTibero Co., Ltd. Nothing in this software document and agreement constitutes a transfer of intellectual property rights regardless of whether or not such rights are registered) or any rights to TmaxTibero trademarks, logos, or any other brand features.
This document is for information purposes only. The company assumes no direct or indirect responsibilities for the contents of this document, and does not guarantee that the information contained in this document satisfies certain legal or commercial conditions. The information contained in this document is subject to change without prior notice due to product upgrades or updates. The company assumes no liability for any errors in this document.
SysMasterDB 8® is a registered trademark of TmaxTibero Co., Ltd. All other product and company names are trademarks of their respective owners and are used for reference purposes only.
Spoqa Han Sans Neo and Inconsolata are used under the SIL Open Font License.
Detailed information can be found in the directory located within the product. ${INSTALL_PATH}/license/font_li censes
Some modules or files of this product are subject to the terms of the following licenses. Apache License 2.0, BSD 2-Clause License, CDDL 1.0 / 1.1, Confluent Community License, Eclipse Public License (EPL) 1.0 / 2.0, Eclipse Distribution License 1.0, GNU General Public License (GPL) 2.0, GNU Lesser General Public License (LGPL) 2.1, MIT License, MIT-0, Mozilla Public License (MPL) 1.1 / 2.0, Public Domain (including CC0), Revised BSD License, The JSON License, WTFPL
Detailed information can be found in the directory located within the product. $BINARY_HOME/oss_license
The guide contains 8 chapters.
Describes the installation process for SysMasterDB 8.
Guides the user a setup process, including connecting to SysMasterDB and setting permissions.
Accesses each menu in SysMaster and use its functions via the Global Navigation Bar.
Provides an overview of the SysmasterDB Dashboard.
🔎
Provides an overview of the monitoring features that allow the users to view information in real time.
🔎
Provides an overview of the analysis features available in SysmasterDB.
🔎
Provides an overview of various settings menus, including Group and User.
🔎
Provides a brief description of the components monitored by the instance monitoring service.
🔎
This guide is not intended to be all-inclusive of everything you need to know to apply or operate SysMasterDB 8.3 in practice.
Alert Item: The metric targeted by the alert
Threshold: Alert occurrence criteria
Instance: Name of the instance where the alert occurred
Alert Trigger: Indicates the cause of the System Alert.
Click the Go to Alert Events History button at the bottom to Go to Alert event history .
Tablespace: Displays the number of tablespaces with usage exceeding 90%. Hovering over the chart displays usage details for the top 10 tablespaces in descending order.
Running Session: Displays a simple area chart showing the trend of running sessions over the past minute, with the current number of running sessions displayed in the middle.
If the monitored instance DB is in a down state, displays the time when it was last in a normal state.
Password
User's password
Mail Address
The user's email address
Phone
User's mobile phone number
Date Format
The date format to be displayed on the service screen
Description
Description of the user
When creating a user, it is mandatory to check for duplicate IDs.
The password must be at least 8 characters long and include letters, numbers, and special characters.
User ID
User ID
Group&Role
The group to which the user will belong and the role (Role) within that group
Select the Time Slice divided by the Time Unit within the interval to open the screen for that Time Slice.
The users can check which SQL generated the most metrics the users are interested in, such as Physical Reads and Hard Parse Count.
The users can view the trend of the set metrics through a Heatmap and link to the Performance Trend or Top N Performance page for the desired period for further analysis.
Note
Time Unit values must be natural numbers between 1 and 99.
Note
When Tibero Wait Event metrics show a Count of 0 or higher but a Time of 0
The Wait Event Time collected by the Tibero library is recorded down to the nanosecond level, but the metric aggregation and output are performed in microseconds. Therefore, if only nanosecond-level Waits occur, the Wait Count may be greater than 0, but the Wait Time will be displayed as 0.
CPU
Real-time CPU usage of the instance
Lock
Real-time lock waiter session count for the instance
Alert
Real-time status and number of unacknowledged alerts for the instance
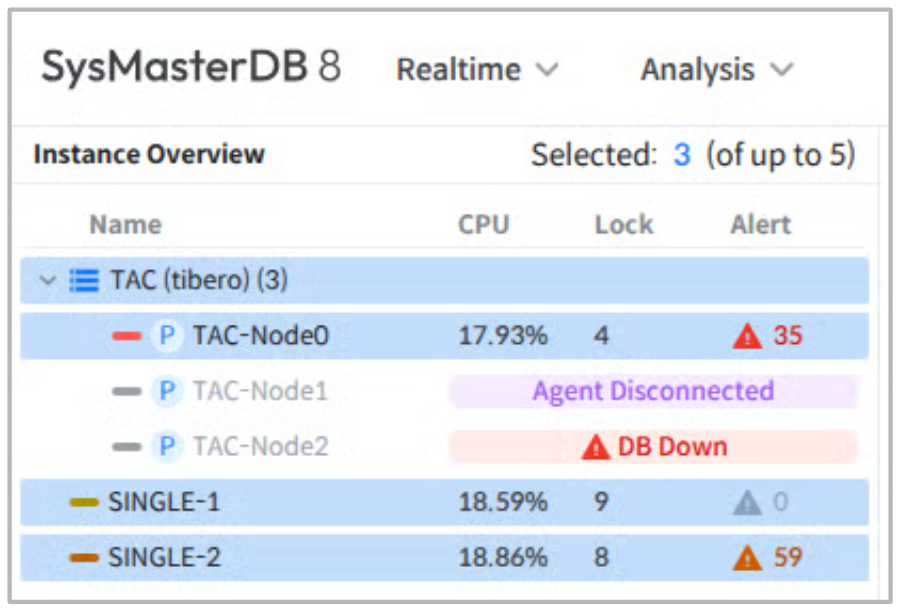
If the instance is in a DB Down or Agent Disconnected state, it is displayed in a separate format as follows.
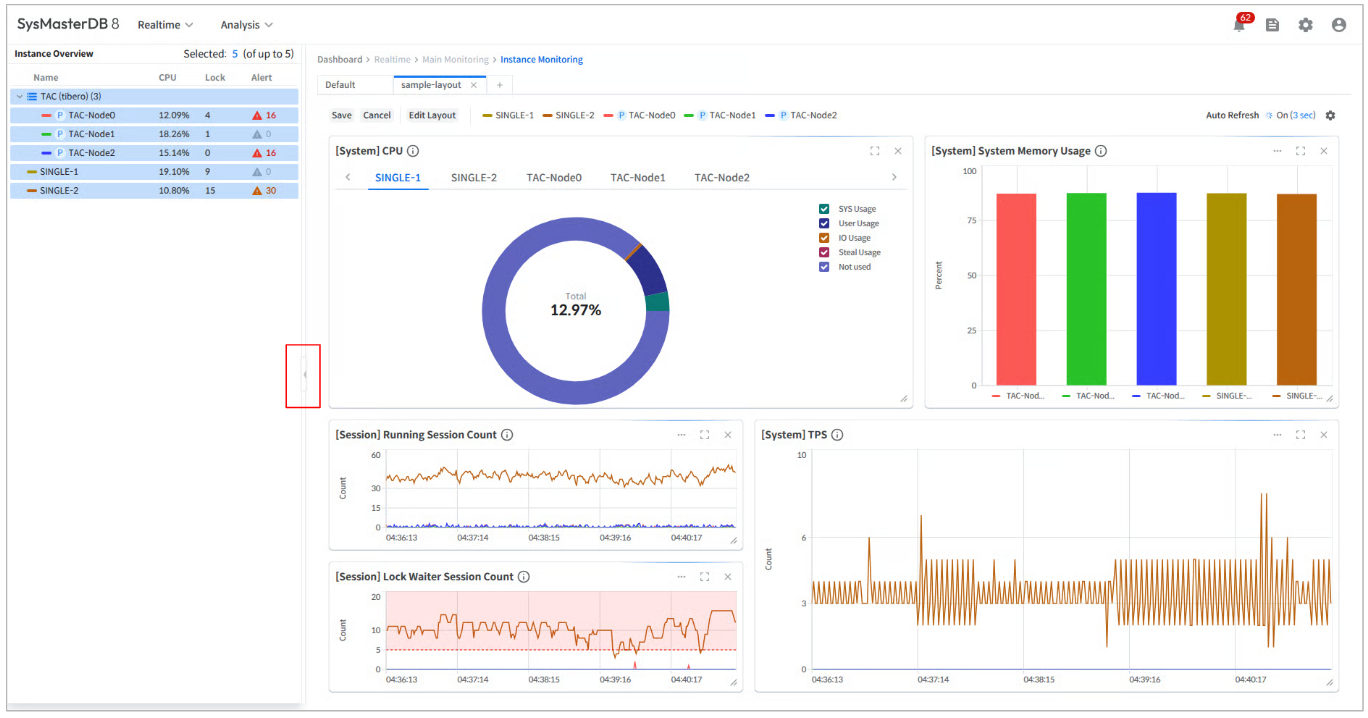
Additionally, users can click the collapse button to collapse or expand the Instance Overview area side panel as needed.
SID
Session SID
Serial#
Serial number of the session
User
Session username
Program
Session program name
Module
Views a time-based chart of the usage of Stat-related items (such as 'Logical Reads', 'Physical Reads', 'Execute Count', etc.).
The users can change the resource to view by using the combo box on the right side of the indicator selection button area.
View time-based charts for the usage of WAIT-related items (such as 'WE_JC_BUF_DISK_READ_TIME', 'WE_BUF_FREE_TIME', etc.).
At this point, the users can change the resource to be viewed by using the combo box on the right side of the indicator selection button area
View time-based charts for the usage of items related to Wait Count ('WE_JC_BUF_DISK_READ_COUNT', 'WE_BUF_FREE_COUNT', etc.).
The users can change the resource to view by using the combo box on the right side of the indicator selection button area.
View a time-based chart showing the usage of items related to Sessions ('Active Session', 'Lock Waiter Session').
At this point, the users can change the resource to be viewed by using the combo box on the right side of the indicator selection button area.
SID
Session SID
Serial#
Serial number of the session
User
Session user name
Program
Program name of the session
Module
Click a specific time in the User created tab or System tab chart to view the list of alerts for that time.
Alert Time
The time when the alert occurred
Alert Name
Alert name
Alert Level
Alert level (INFO, WARNING, ERROR)
Clicking the zoom icon in the upper-right corner of the chart opens a modal window where the users can zoom in to view the chart in more detail.
Click and drag the bottom-right corner of the chart to adjust its size.
Click the close icon in the upper-right corner of the chart to remove the chart from the current layout.
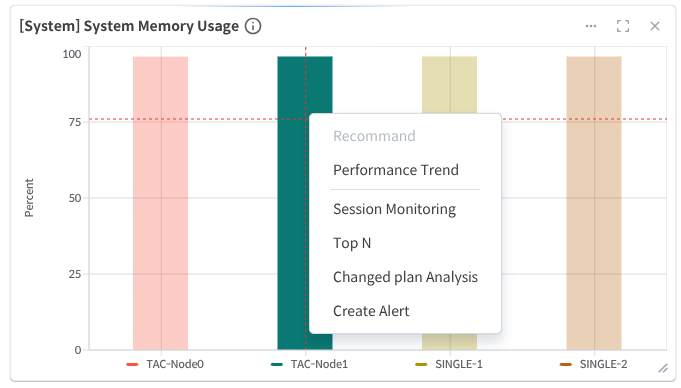
Some chart types provide a feature that links to other pages for user convenience during real-time monitoring..
This feature is available when clicking on a specific instance graph in Bar, Line, Area, and Stack Bar charts, and the navigable pages are as follows.
Realtime > Session Monitoring
Analysis > Performance Trend
Analysis > Top N Performance
Analysis > Changed Plan Analysis
Settings > Create Alert

Tablespace Name
Tablespace name
Name
File name including file path
Physical Reads
Number of physical reads
Physical Writes
Number of physical writes
Physical Block Reads
Note
Only users with [Data Collection] permissions for the selected instance in Configurable Privileges can use the [Collect] button.
User Name
OS User
OS Name
Machine
Host name of the connected session
Terminal
Terminal (TTY) information of the connected session
Program
Program name of the session
Module
The name of the module specified by dbms_application_info.set_module
Type
Session type
WTHR: Working thread
CTHR: Control thread
LGWR: Log writing process
Logon Time
The logon time of the session
User Name
Note
Due to an issue with the Tibero library used for collecting session information, some items such as User Name, Schema Name, OS User, Machine, Terminal, Program, and Module may not be collected.
IP Address
IP address of the DB to be monitored
Port
Port number for connecting to the monitored DB
DB Name
SID of the DB to be monitored
User ID
User name of the DB to be monitored
Password
Password of the user in the target DB
Instance ID
Instance ID
Instance Color
Unique color of the instance (color displayed in the chart)
Note
The Instance ID entered when registering the instance must match the ID in the TPM Agent's configuration file.
Caution
If the IP:PORT in LOG_REPLICATION_DEST_N = "hostname_N:port_N {LGWR SYNC|LGWR ASYNC|ARCH ASYNC}" differs from the IP:PORT used when registering the standby instance in the SysMaster DB, the topology network configuration in the TSC monitoring screen will not display correctly.
SQL ID
SQL ID
SQL Text
SQL Syntax
Child Number
Child Number in SQL
Performance Trend
Go to the main screen of the Analysis Performance Trend menu. For more details about this menu, refer to “Performance Trend”.
Top N
Go to the main screen of the Top N Performance menu. For more information about this menu, refer to “Top N Performance”.
Note
The users can hide the Card View Settings Panel by using the Hide button in the upper right corner

Install Docker or Podman depending on the engine the users wish to use.
If using Docker engine
The users can run SysMasterDB using Docker-compose or Kubernetes.
If using on RHEL
The users can run the SysMasterDB using the Podman-compose environment.
Refer to the Docker Engine installation guide at the following address and install the appropriate Docker Engine for the usersr operating system.
The installation method varies depending on whether the installation environment has an internet connection.
If the installation environment has an internet connection
Follow the "Install using the repository" process.
At this point, we recommend installing the latest version without specifying a specific version.
During the Docker Engine installation process, the packages that must be installed are docker-ce, docker-ce-cli, containerd.io, and docker-compose-plugin.
Use the docker version command to verify that Docker/Podman is installed correctly.
Follow the installation instructions provided at the following link.
The packages that must be installed during the Podman engine installation process are podman, Slirp4netns, and podman-plugins.
Use the podman version command to verify that Docker/Podman is installed correctly.
Select and install one of the following: 'Docker-compose', 'Kubernetes', or 'Podman-compose'.
When installing Docker, the docker-compose-plugin package is installed automatically. If Docker is installed correctly, no additional installation is required for the docker-compose environment.
Use the docker compose version command to verify that Docker Compose is installed correctly.
Podman-compose
Podman-compose is a tool that allows the users to use podman in the same way as docker-compose.
It is built on Python and can be installed using pip.
sudo pip3 install podman-compose
Kubernetes
Follow the instructions at the following link to install Kubernetes, then install the version appropriate for the usersr operating system.
Additionally, check the Kubectl installation instructions at the following address and install Kubectl appropriate for the usersr operating system.
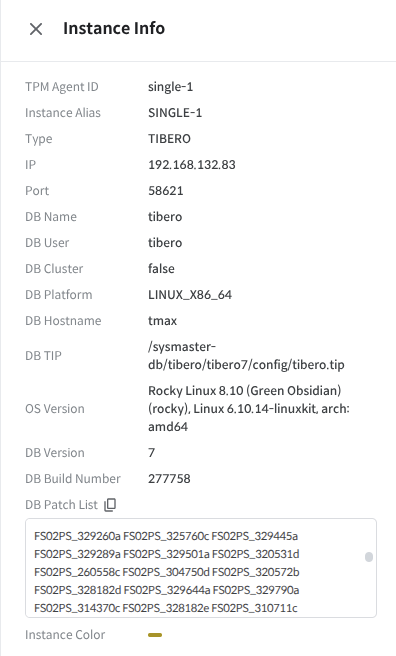
Provides detailed information about the monitoring DB instance and equipment.
TPM Agent ID
TPM Agent's Internal identifier ID of the DB set in the application.yml file
This is how to start, check logs, stop, and initialize the SysMaster DB in a Kubernetes environment.
Execute the following commands in the directory where the installation file is located to create Kubernetes objects.
kubectl apply -f kubernetes/initkubectl apply -f kubernetes/dbBefore proceeding to the next step, ensure that RepoDB and MetaDB have booted successfully. This can be verified through the following logs.
First, verify that the following messages are displayed in the terminal output logs of each pod.
[ENTRYPOINT LOG]: INFO: Attempting to start PostgreSQL server...Next, verify that the following message is output in the log file of each database.
LOG: database system is ready to accept connectionsThe method for checking each database's log file is described in "".
After booting is complete, login and program use are possible. Boot completion can be confirmed via the SDM log with the following log:
By default, the users can access the log files of each module by connecting to the containers within the pods. The SysMaster DB modules log files are stored in the following paths within each container.
Additionally, for user convenience, the users can create and use a dedicated container for log verification.
The sysmasterdb8-log-container, a dedicated log viewing container, is defined within the sysmasterdb8-client-pod specified in the client-deployment.yaml file included in the deployment file configuration. Users can view logs from all SysMaster DB modules by accessing the log directory path (/sysmaster/logs) within this container.
To terminate SysMaster DB, execute the following commands in the directory where the installation files are located. Note that even after terminating SysMaster DB, the data files in the Repository DB and Meta DB are retained, so the users can use the previously saved data by restarting SysMaster DB.
Running the following commands will delete all data and restore the system to its initial installation state. However, previously saved data will not be available.
This chapter describes the Analysis menu, which enables period analysis of accumulated data through real-time indicator collection.
Performance Analysis - Analyzes metrics related to performance.
History Analysis - Analyzes trends in changes over time, such as plan changes, connection session counts, alert occurrence rates, and the number of invalid objects.
- The users can monitor trends in the usage of Tablespace, Filesystem, Segment, Temp Tablespace, and Undo Tablespace.
This section describes the common features used in the submenus of the Analysis service.
This is a dropdown menu that appears when entering the Analysis submenu. The users can select the instance to monitor from this dropdown menu.
Analysis Click the dropdown menu in the upper-left corner of the Analysis menu screen.
Click the Instance dropdown menu.
When the drop-down menu appears, select the desired instance, and the monitoring information for that instance will appear on the screen.
The submenu of Analysis provides a Period Selector. Users can set the period for data analysis using the Period Selector. Set the period in the Period area and click the [VIEW] button on the right to view the data for the target period. By default, the period is set to 1 hour, but if a specific period is required, the users can select Custom to view data for the desired period.
Search range and chart data unit default rules
By default, the chart data units are supported in minutes, hours, and days, and the unit changes based on the number of data points (120).
Example 1: Search range of 120 minutes (2 hours) or less is displayed as minute-unit data.
Example 2: Search range exceeding 120 minutes (2 hours) but less than 120 hours (5 days) is displayed as hour-based data.
Example 3: Search range exceeding 120 hours (5 days) is displayed as day-based data.
Example 1: Minimum search unit [minutes], chart data follows the default rule Performance Trend Alert Analysis
Example 2: Minimum search unit [hours], chart data is provided in time units Invalid Object Tablespace Usage Filesystem Usage Temp Usage Undo Usage
Case 3: Minimum search unit [day], chart data is provided in time units Heatmap Trend
Displays the past execution history and statistics of SQL statements identical to those currently being executed in the current session.
To view the history of SQL statements that are identical to those currently being executed in the current session, the users can select the desired period and view the history.
Displays the full text of the SQL currently being executed in the current session.
This screen allows the users to view the plan for the SQL currently being executed in the current session. The SQL plan is displayed in a tree structure.
Displays statistical information about the past history of SQL statements identical to the currently executing SQL. Displays Summary, execute count, physical reads, logical reads, plan history, and SQL trace items.
The Summary tab displays stat indicators and a list of wait events for the analysis period, as well as the wait time values for each wait event.
The Execute Count tab displays the Execute Count by time unit in a chart format.
On the Physical Reads tab screen, the users can view the Physical Reads by time unit in chart form.
On the Logical Reads tab screen, the users can view Logical Reads in chart form by minute.
The Plan History tab screen allows the users to compare plans for the same query.
The SQL Trace tab displays the SQL execution history (trace information) for the specified query period.
Click [Analysis] > [Performance Analysis] > [Top N Performance] in the global navigation bar to open the Top N Performance screen.
In the Top N Performance screen, the users can view the top SQL statements during the search period.
When the users set the Category and Item, the users can view the Value for the selected Item. Additionally, selecting a value in the Category and double-clicking it allows the users to view information about the SQL, and selecting an SQL and double-clicking it links to the SQL Detail screen.
The following is a description of each area in the tab screen.
Data aggregation criteria include 'Machine', 'Module', 'Program', 'Username', and 'OS user'. When 'SQL' is selected, no aggregation criteria are set.
Aggregation items include 'Logical Reads', 'Physical Reads', 'Redo Entries', 'Execute Count', etc.
By selecting Category and Item, the users can view performance metrics for the monitoring period. At this time, the users can specify the number of items in the sort list (ALL / Top 20 / Top 30 / Top 50) for categories other than SQL Category using the combo box in the upper-right corner of the area.
The following is a description of the items provided in the Category / Module area.
Displays SQL statements from the Category / Module with the highest Item (Logical Reads) values in descending order. Double-clicking on a SQL statement takes the users to the SQL Detail screen.
The following is a description of the items provided in the MODULE / SQL area.
Click [Analysis] > [History Analysis] > [Invalid Object] in the global navigation bar to open the Invalid Object page.
The Invalid Object page displays the Invalid Objects Count data and detailed information about invalid objects.
The users can view the Invalid Objects Count information for the specified period.
When the users click on a specific data point in the Invalid Objects Count chart, it provides the complete Invalid Object information included in that data count. This allows users to view detailed information about Invalid Object data for each time period.
The following is a description of the items provided on the Invalid Objects screen.
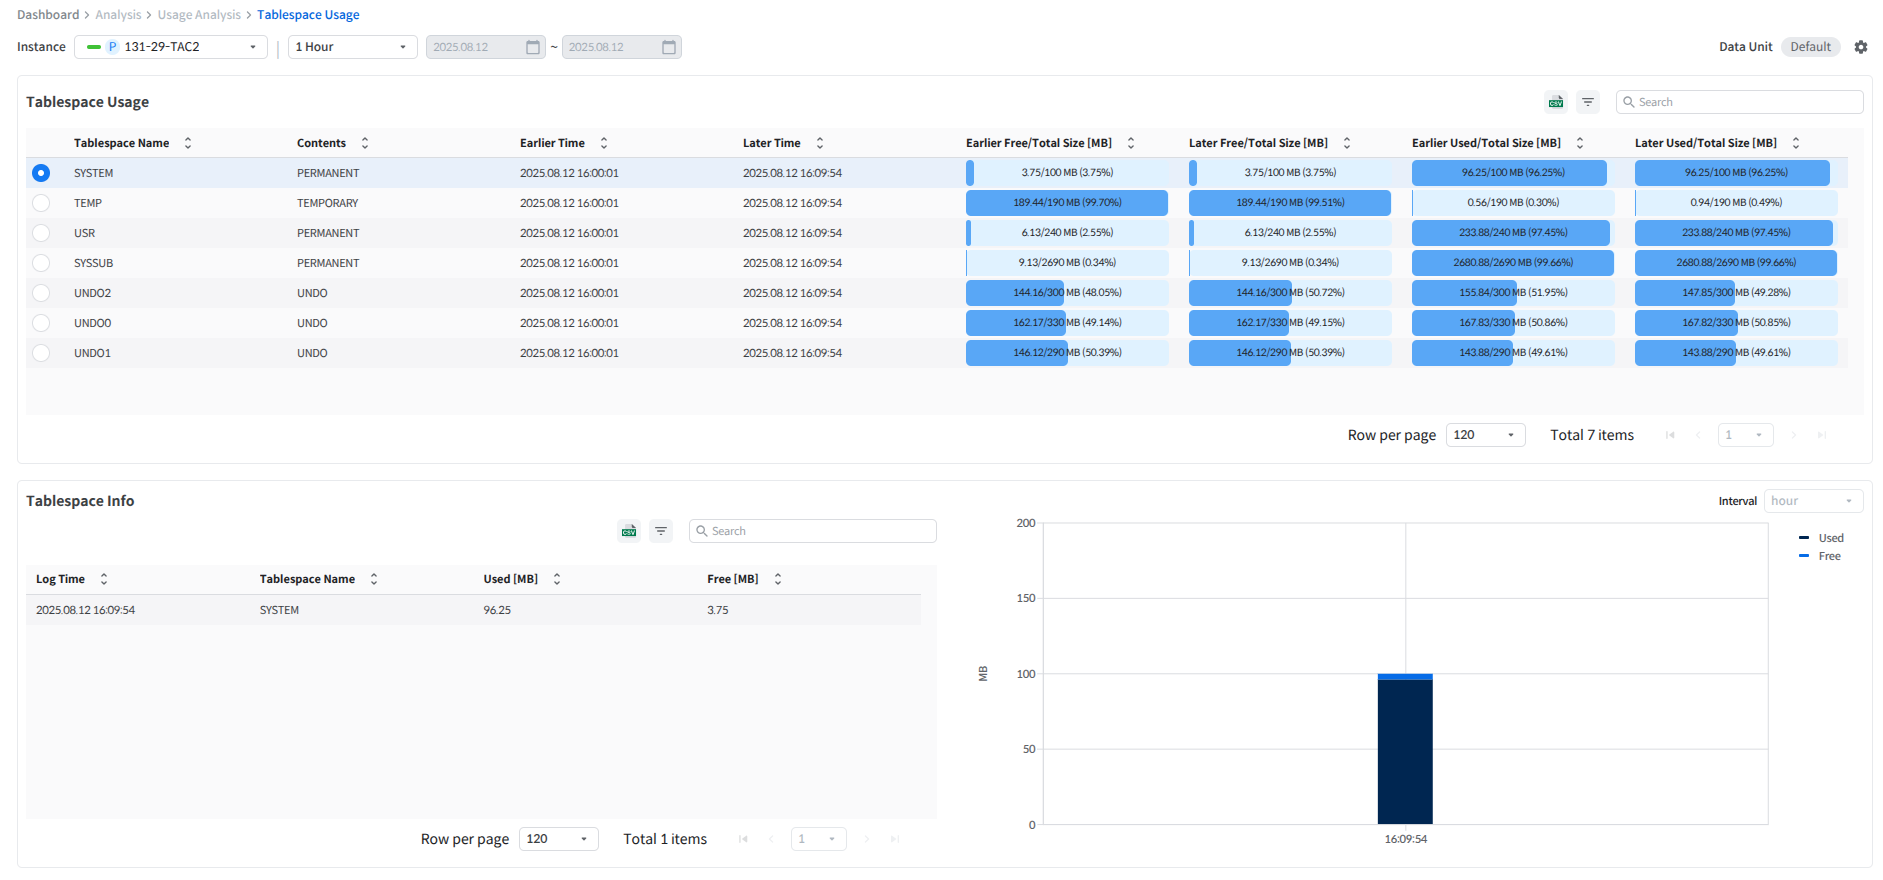
Click the [Analysis] > [Usage Analysis] > [Tablespace Usage] menu in the global navigation bar to open the Tablespace Usage screen.
This screen displays the changes in the size of each tablespace name over the specified period.
The following is a description of the items provided in the Tablespace Usage screen.
When the users click on a specific data in Tablespace Usage, the users can view detailed changes in the size of the corresponding tablespace over time. The graph on the right allows the users to quickly grasp the size changes at a glance.
The following is a description of the items provided in the Tablespace Info screen.
When registering the monitoring database in SysMaster DB, the users will be prompted to enter user information. The users can use an existing user or create a new one. The required permissions for the user are CONNECT, ALTER SYSTEM, and SELECT_CATALOG_ROLE. User creation and permission assignment are performed using the following DDL and DCL statements in the SYS account.
Additionally, to use the TPR Report and ASH Report features, the users must grant the relevant permissions using the following DCL statement:
To collect statistics generated when executing SQL in the monitoring database, add the 'SQL_STAT_HISTORY', 'SQL_STAT_HISTORY_THRESHOLD', and 'SQL_STAT_HISTORY_QSIZE' parameters to the tip file. The descriptions for each parameter are as follows.
After completing the application.yml file settings, configure the TPM Agent environment in the following order.
set.sh script content
The users can view various metrics of instances within the currently monitored group.
Through customization, the users can place all real-time charts, sessions, and lock monitoring tables supported by SysMaster in any desired location and size.
Clicking on a chart allows the users to navigate to the desired screen.
Click the [Realtime] > [Lock Monitoring] menu in the global navigation bar to open the Lock Monitoring screen.
The Lock Monitoring screen displays lock information between sessions in a tree format. Therefore, the users can monitor the Holder Session that is currently holding the lock and the Waiter Session that is waiting to acquire the lock. Additionally, the users can monitor the session holding the lock and terminate a specific session.
The following is a description of the items provided in the Lock Tree Table screen.
Click [Realtime] > [Main Monitoring] > [Server Monitoring] in the global navigation bar to open the Server Monitoring page.
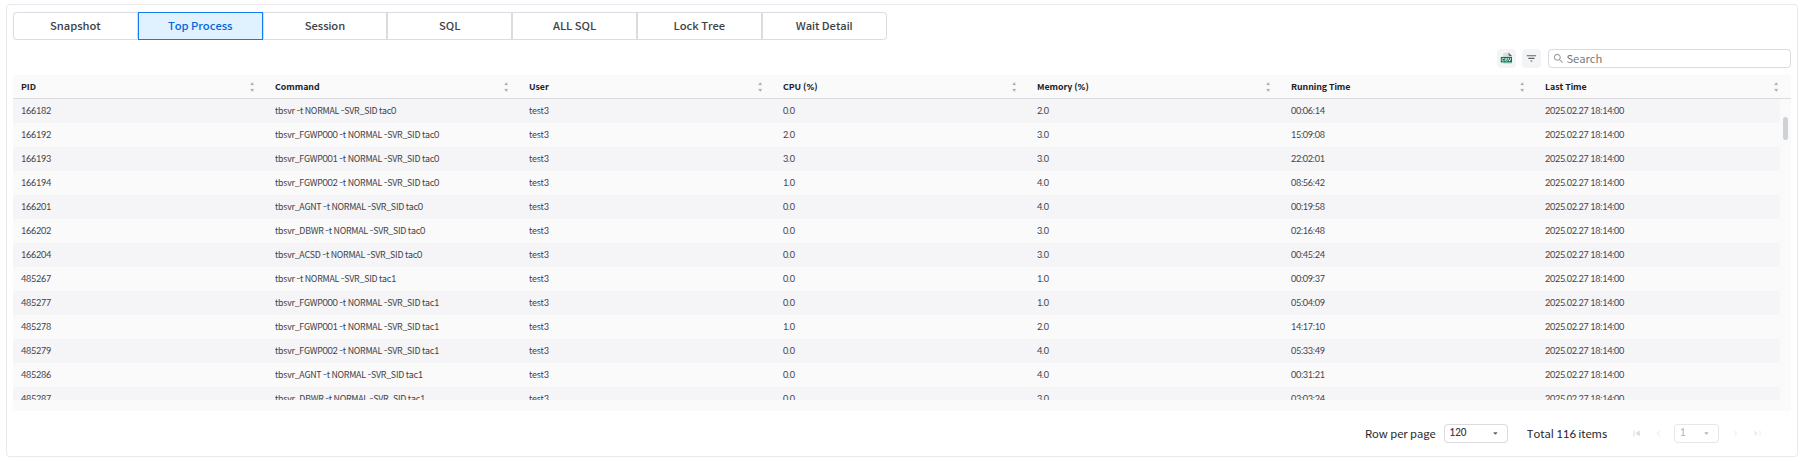
The Server Monitoring page displays information about OS-level CPU and memory system resource usage, as well as CPU and memory usage for processes. It provides filtering functionality by conditions such as PID, User, CPU (%), and Memory (%), allowing the users to monitor the overall status of resource usage across all processes.
Clicking the [Refresh] button in the top-right corner of the Server Monitoring page allows the users to monitor CPU usage in real time.
The CPU screen in the top-left corner of the Server Monitoring page displays CPU usage by User and System areas, as well as the current total CPU usage in a chart.
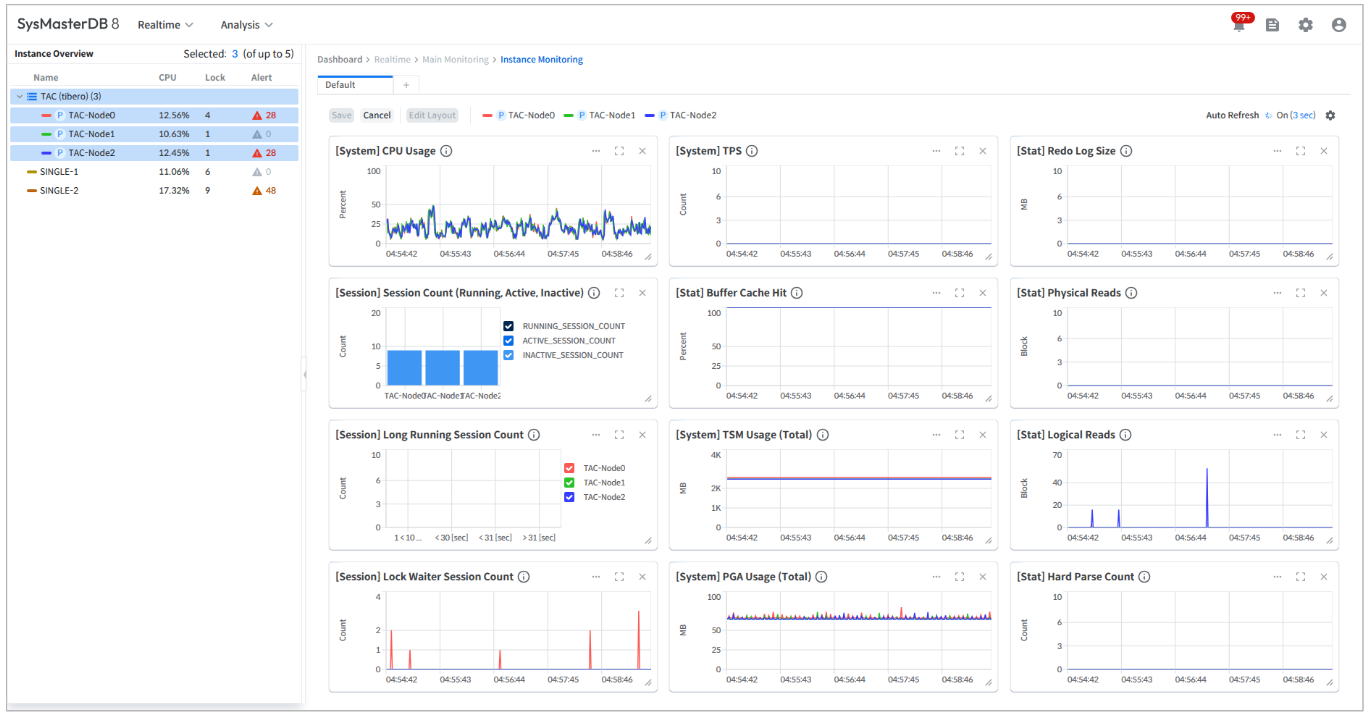
This section describes the basic features available in the Layout Tab area of the Instance Monitoring page.
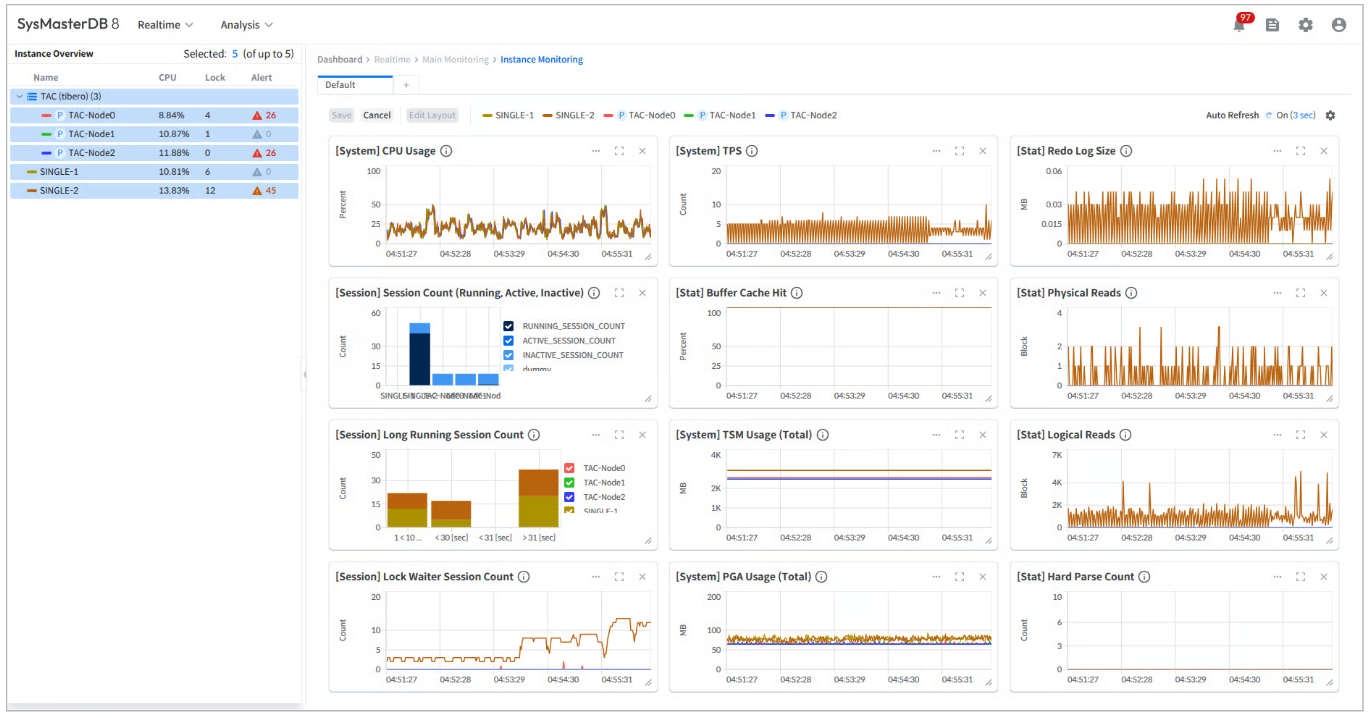
For user convenience, the Instance Monitoring page provides a Default Layout.
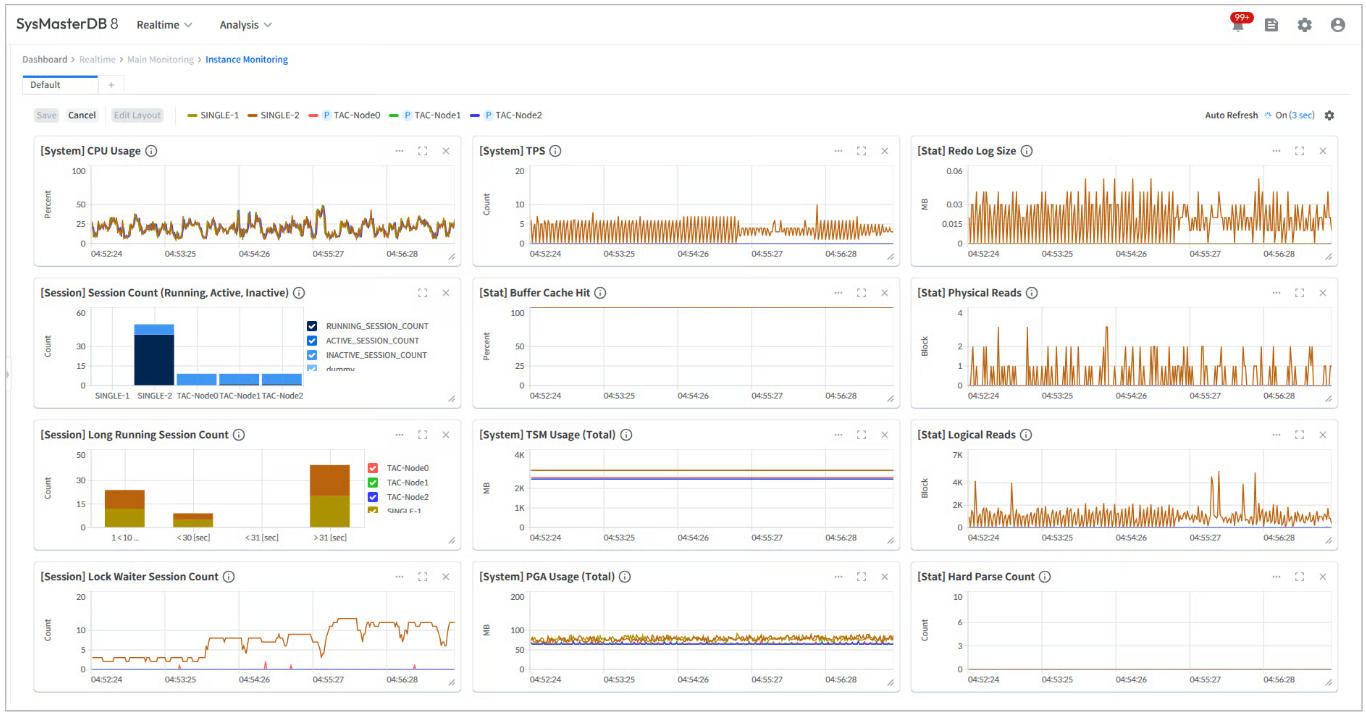
The list of monitoring metrics included in the Default Layout is as follows.
[System] CPU Usage
Click the [Analysis] > [Usage Analysis] > [Temp Usage] menu in the global navigation bar to open the Temp Usage screen.
This screen displays the change in Temp size over time for the specified period.
The users can view detailed information about the total Temp usage of the selected items in Temp Usage.
Click the [Analysis] > [Usage Analysis] > [Filesystem Usage] menu in the global navigation bar to open the Filesystem Usage screen.
This screen displays the changes in the size of files mounted on servers by filesystem name during the specified period.
The following is a description of the items provided in the Filesystem Usage screen.
If the installation environment has not an internet connection
Follow the "Install from a package" process to download and install the package-specific installation files separately.
At this time, we recommend installing the latest version for each package.
The following is an example of the installation file path for Centos 7, x86-64.
https://download.docker.com/linux/centos/7/x86_64/stable/Packages/
Verify that Podman-compose is installed correctly.
podman-compose version
Note
For Linux, it is recommended to configure the system using the following address to operate without the sudo command after installing the Docker Engine.
Note
Podman supports rootless container functionality, allowing containers to be run without the sudo command. Since disk volumes cannot be mounted on rootless containers in Linux Kernel 4.18 or earlier, Podman is supported starting from Red Hat Enterprise Linux 8.



Instance Alias
Instance name displayed in the SysMaster DB UI
Type
Monitoring DB type
IP
IP address of the monitored instance.
Port
Listener port of the monitored instance.
DB Name
DB name of the monitored instance. (DB SID for TIBERO)
DB User
Monitoring account for the target instance
DB Cluster
Indicates whether the target is part of a cluster
DB Platform
OS installed on the target device
DB Hostname
Hostname of the device where the target instance is installed
DB TIP
TIP file for the target instance (Configuration file) path
OS Version
Detailed information about the OS installed on the target device
DB Version
Version information of the target instance
DB Build Number
Build number of the target instance
DB Patch List
List of patches applied to the target DB
Note
Always delete the SysMaster deployment and Kafka deployment together.
RepoDB and MetaDB deployments do not necessarily need to be deleted, and the users can still access RepoDB and MetaDB to check data even after SysMaster is terminated.
kubectl apply -f kubernetes/kafkakubectl apply -f kubernetes/sysmasterStarted SdmApplication in ... seconds (JVM running for ...)/sysmaster/logskubectl delete -f kubernetes/sysmasterkubectl delete -f kubernetes/kafkakubectl delete -f kubernetes/dbkubectl delete -f kubernetes/initNote
The Performance trend overall screen and Heatmap trend initial screen display data based on the default time.
The Period selector changes the unit of data retrieved based on the search range, and each submenu under Analysis has different rules and minimum search units.
Ratio(%)
Ratio by SQL
Module
Information about the value selected in Category– Module: Module name – Program: Program name – Username: Database user name – OS user: OS user name – Machine: Control DB hostname
Value
Total for the selected criteria (Category, Item)
Ratio (%)
Usage ratio for each item
SQL ID | Child Number
SQL ID and Child Number of the SQL
SQL Text
SQL Syntax
Value
Values for the selected criteria (Category, Item) for each SQL
Note
Due to an issue with the Tibero library used to collect SQL execution history, some information may not be collected for the Machine, Module, Program, Username, and OS User items.
Sub Object Name
Sub Object Name of Invalid Object
Object Type
Type of Invalid Object
Status
Status of Invalid Object (INVALID)
Last DDL Time
Time when the last DDL was executed for the invalid object
Log Time
The time when the Invalid Object data was collected.
Owner
Owner of the Invalid Object
Object Name
Object name of the invalid object
Later Free/Total Size
Free space status at a later point in time
Earlier Used/Total Size
Previous usage status
Later Total/Total Size
Usage status at a later point in time
Free
Available amount
Tablespace Name
Tablespace name
Contents
Data types stored in the tablespace
TEMPORARY
PERMANENT
UNDO
Earlier Time
Previous Time
Later Time
Later time
Earlier Free/Total Size
Log Time
Collection time
Tablespace Name
Tablespace Name
Used
Used
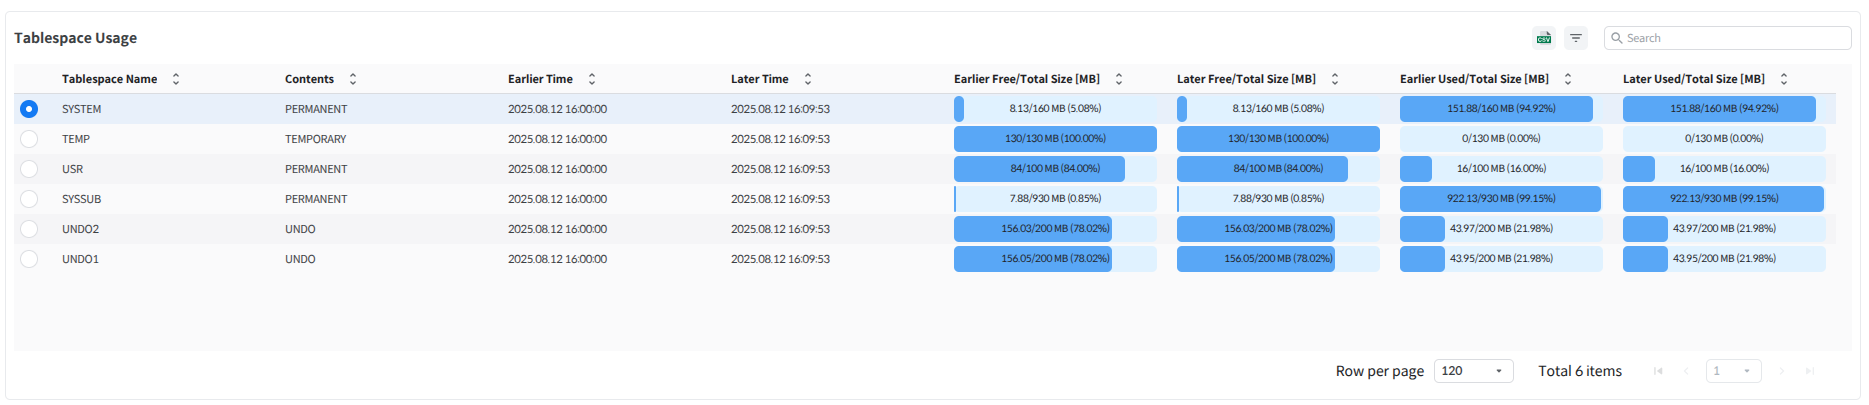
Free space status at the previous time point
CKPT: Checkpoint process
LARC: Log archive
AGENT: Sequence process
MTHR: Monitoring process
DBWR: Datablock writing processLNW: Log network writing process
SQL_STAT_HISTORY
Whether to generate SQL execution information
Y (required)
Not possible
SQL_STAT_HISTORY_THRESHOLD
SQL execution information creation threshold execution time (e.g., only create execution information for SQL that took 100 milliseconds or longer to execute)
100
Possible
SQL_STAT_HISTORY_QSIZE
Number of SQL execution information to be stored per session (An integer between 1 and 10000)
The amount of shared memory used increases in proportion to SQL_STAT_HISTORY_QSIZE and the total number of sessions in the database. Therefore, when changing SQL_STAT_HISTORY from N to Y, the increased memory usage must be added to TOTAL_SHM_SIZE. For database stability, we recommend adding an additional 3–5% to the result of (increased memory usage) + TOTAL_SHM_SIZE to obtain the final TOTAL_SHM_SIZE value.
For DB_CACHE_SIZE, which is automatically changed by TOTAL_SHM_SIZE, set it to the value when SQL_STAT_HISTORY was N to minimize the impact.
When SQL_STAT_HISTORY_QSIZE=1, the memory used for SQL STAT HISTORY in a single session is approximately 231,000 bytes. Therefore, multiply this value by the total number of sessions (MAX_SESSION_COUNT + WTHR_PER_PROC) (including both MGWP and FGWP) and SQL_STAT_HISTORY_QSIZE.
The libtpmstat library is required for the TPM Agent to collect information from Tibero. If the 279651 patch has been applied to the management database and the libtpmstat library is available, the users can use the library by configuring the Tibero environment variables.
If the libtpmstat library is not available in the management database, the users must distribute the appropriate library for that database. After distributing the libtpmstat.so file, move it to the TPM Agent directory and configure the TPM Agent library path to use the library.
CREATE USER [username] IDENTIFIED BY [password];
GRANT CONNECT, ALTER SYSTEM, SELECT_CATALOG_ROLE TO [username];GRANT EXECUTE ON SYS.DBMS_TPR TO [username];
GRANT EXECUTE ON UTL_TPR TO [username];Note
SysMasterDB 8.3 does not create tables or load data into the control database.
Note
1. If SQL_STAT_HISTORY is set to Y, each session stores SQL execution information that has been executed at least SQL_STAT_HISTORY_THRESHOLD times in a queue of size SQL_STAT_HISTORY_QSIZE.
2. When the queue is full, the oldest SQL execution information is deleted from the queue.
3. The TPM Agent collects SQL execution information every SQLTRACE_FREQ (ms), so
SQL_STAT_HISTORY_QSIZE must be set to a value such that SQLTRACE_FREQ / SQL_STAT_HISTORY_THRESHOLD ≤ SQL_STAT_HISTORY_QSIZE
Note
MAX_SESSION_COUNT=500, WTHR_PER_PROC=10, SQL_STAT_HISTORY_QSIZE=10, TOTAL_SHM_SIZE=3500M, when SQL STAT_HISTORY=Y, approximately 231,000 × ( 500 + 10 ) × 10 = 1,178,100,000 bytes = 1,123.52 MB is used.
For TOTAL_SHM_SIZE, set it to ( 3500 + 1124 ) × 1.03 ~ 1.05 = 4,763 ~ 4,855 MB.
Note
To distribute the libtpmstat.so library file, the users must build libtpmstat.so using a management database build that has the exact same patches as the management database patch list. For example, if there are three patches ([1st patch], [2nd patch], [3rd patch]) in Tibero 6, and [1st patch], [3rd patch] in another location, the users must build and distribute both the libtpmstat.so file built from Tibero with [1st patch], [2nd patch], and [3rd patch] applied, and the libtpmstat.so file built from Tibero with [1st patch] and [3rd patch] applied.
Additionally, when building the libtpmstat.so library, all build flags applied during the Tibero binary build must be applied identically during the library build. For example, if the NET_BACKUP build flag was applied when building and distributing the Tibero binary, the same flag must be included when building the libtpmstat.so library for distribution.
{Monitoring_DB_Path}
Enter the path to the monitoring database
{Monitoring_DB_SID}
Enter the SID of the monitoring database
The tpmctl.sh command is as follows, and the users can check the usage in the terminal with the help command.
./tpmctl.sh [-p port] up
Starts the TPM Agent. The -p option allows the users to specify JVM debug ports. By default, it searches for available ports, but if no available ports are found in the current environment, the users can manually specify a port using this option.
./tpmctl.sh down
Stop the TPM Agent
./tpmctl.sh help
Display TPM Agent help
This library is required for Java TPM Agent to use libtpmstat.so.
After Tibero Down, TPM Agent Down is required to immediately perform Tibero Boot. This is because the Tibero Shared Memory referenced by TPM Agent must be released.
ulimit -c unlimited. set.shexport TPMAGENT_HOME={TPM_Agent_Home_Path}
export PATH=$TPMAGENT_HOME:$PATH
export LD_LIBRARY_PATH=$TPMAGENT_HOME:$LD_LIBRARY_PATH
export BOOT_WITH_AUTO_DOWN_CLEAN=true
export ENABLE_DEBUG=false
export ENABLE_GC_LOG=false
export JAVA_MIN_HEAP_SIZE=300m
export JAVA_MAX_HEAP_SIZE=300m{TPM_Agent_Home_Path}
Note
The above script is a template that provides the basic settings for the binary execution PATH, TPM Agent library path LD_LIBRARY_PATH, and environment variables. The users can modify the script directly according to the usersr environment and then run the TPM Agent.
Directory path where the compressed file "java_tpmagent_dist_{version}.tar.gz" is extracted.
export TB_HOME={Monitoring_DB_Path}
export TB_SID={Monitoring_DB_SID}
export LD_LIBRARY_PATH=$TB_HOME/lib:$TB_HOME/client/lib
export PATH=$PATH:$TB_HOME/bin:$TB_HOME/client/binNote
tpSince it must be used with tpmagent.jar, extract the distributed compressed file, copy the libJNITpmStat.so file corresponding to the OS version the users want to run to the same directory as tpmagent.jar under the lib directory.
Caution
If the version of the libtpmstat.so library used by the libJNITpmStat.so file does not match the current Tibero binary version, errors such as SIGSEGV will occur, and the process will not run. The types of error-related files generated vary by JVM vendor, but files such as core, jitdump, and javacore may be created. Therefore, the users must verify the version of the libtpmstat.so library when these files are generated.
Caution
To release the Tibero Shared Memory referenced by the TPM Agent, Tibero Down must be detected, and the detection interval is the same as the data collection interval. Therefore, if the data collection interval is set to a long duration or the TPM Agent itself becomes slow, the detection of Tibero Down may be delayed, resulting in a delay in the timing when Tibero Down can be performed and Tibero Boot can be initiated.
To prevent the delay in detecting Tibero Down and the subsequent delay in the time when Tibero Boot becomes possible, perform TPM Agent Down and then Tibero Boot.
The Y-axis represents response time, and the colors in the heatmap indicate the number of SQL statements corresponding to that response time.
Click the "More" menu to set the Y-axis time range and save it.
Starting Point: The minimum elapsed time value for SQL statements to be displayed on the chart.
Cell Height: The value that sets the Elapsed Time of each cell on the Y-axis of the chart.
Drag the heatmap area or click a cell to view the actual SQL execution details in a separate modal.
Clicking the Instance Name takes the users to another screen for the corresponding instance.
Clicking the SID takes the users to the Session Detail screen for the corresponding SID.
The column contents of the Long SQL List refer to the Chart Type.
Displays TPS (Transactions Per Second) for each instance.
Provides the Elapsed Time of sessions being executed on each instance within the group, divided by time intervals.
The users can define interval values for four intervals based on Response Time.
Click the "See More" button to customize and save the time intervals.
Displays the real-time Running Session / Active Session / Lock Tree status in a table format.
Clicking on the SID of each row allows the users to view the Session Detail and SQL Detail pages.
The users can expand the table by clicking the Maximize button. Before expansion, 10 items based on Elapsed Time are displayed, and after expansion, 50 items are displayed.
Right-click the Custom area to call the Add Chart menu, and the users can add a chart to the Custom area using Add Chart.
Existing charts are highlighted.
The users can select a chart from the Recommend section or choose from all real-time charts provided by the system master in the All section to display on the dashboard.
The users can delete a chart component by clicking the X button on each chart component, and adjust the position or size of the chart by dragging it.
If the users have Admin privileges or higher within the group, or if the users have been granted Custom Privileges, the users can save changes to the Custom Area by clicking the Save button.
Clicking the Reset button will revert the changes.
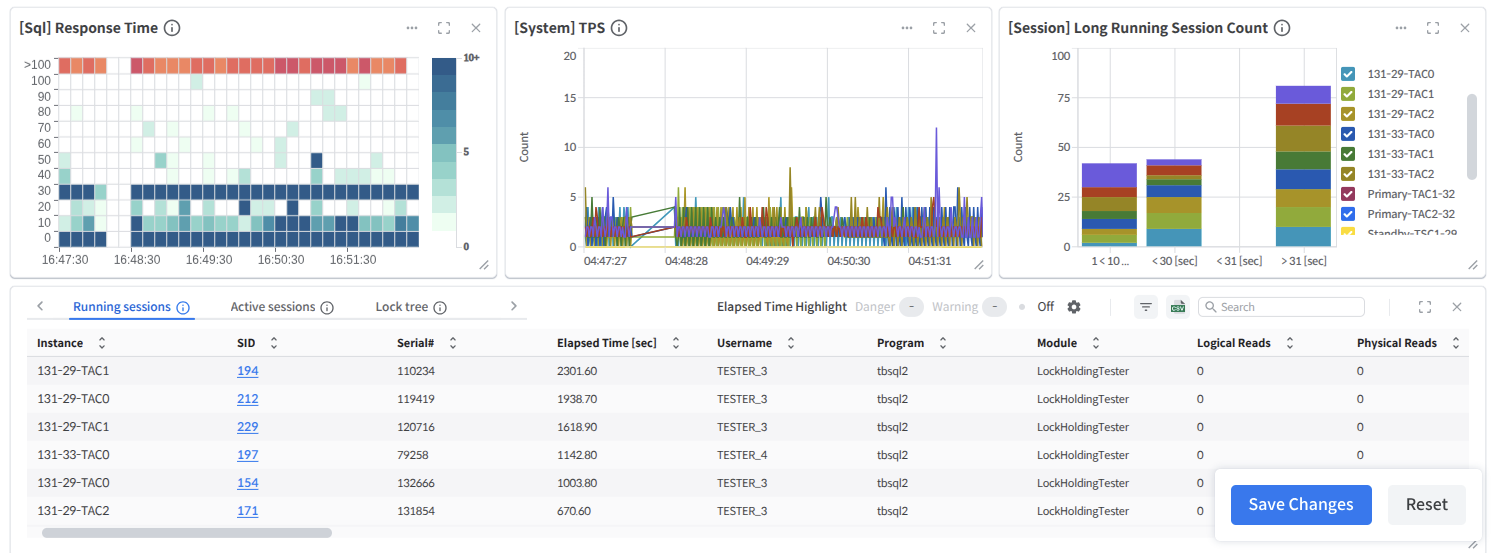
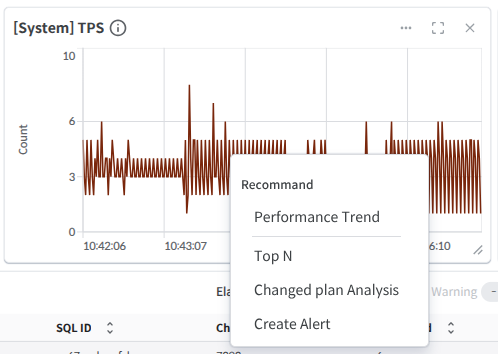
Note
Running Session: Sessions with a Status of RUNNING
Active Session: Sessions with a Status of ROLLING_BACK / TX_RECOVERING / SESS_CLEANUP / CLOSING
Note
All modified content (Card View, Custom Area) will be shared with all users within the group.
Instance
The name of the instance registered in the SysMaster DB
SID
The SID of the session
Serial
The serial number of the session
Elapsed Time
Running time of the session
Status
This feature allows the users to terminate the session holding the lock and release the lock.
First, select the session to be released in the Lock Tree Table, then click the [Kill Session] button in the upper-right corner of the Lock Tree Table screen. This will open the Kill Session pop-up window, where the users can kill the session to release the lock.
Note
This feature is available only to users who have been granted the [Kill Session] permission for the selected instance in Configurable Privileges. For information about pop-up windows, refer to ' in Session Monitoring.
CPU Count
Number of CPU cores
Run Queue
Current Run Queue value
Blocked Queue
Current Blocked Queue value
The Memory screen at the bottom left of the Server Monitoring page displays the total memory size and current memory usage in a chart.
Memory
Total memory
Used
Memory in use
Page In
Number of Page In occurrences
The Current Process Usage page shows the CPU and memory resource usage of each process.
PID
The OS PID value of the process
User
OS user name
CPU
CPU usage at the process level
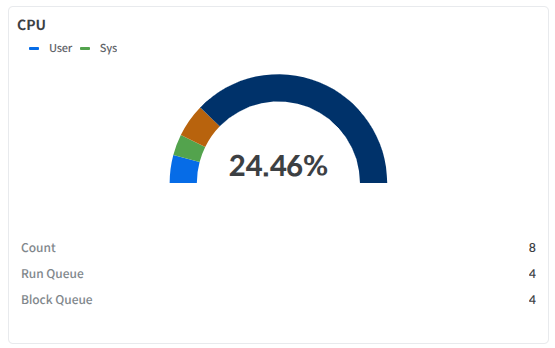
Note
Even if the update occurs faster than the TPM Agent collection cycle, the update is synchronized with the TPM Agent collection cycle. For example, if the CPU, Memory, and Process collection cycle in the TPM Agent is set to 1 minute, even if the Server Monitoring screen is updated every second, the data update will occur every minute.
The CPU usage in the Process list represents the usage of a single core. If it is 100%, it means that one core is being used entirely, and if it exceeds 100%, it means that one core is being used entirely and additional cores are also being used. Therefore, the total value of the CPU usage in the Process list differs from the CPU usage in CPU Monitoring. This is because the CPU usage in CPU Monitoring represents the usage of all cores.
[Session] Session Count (Running, Active, Inactive)
[Session] Long Running Session Count
[Session] Lock Waiter Session Count
[System] TPS
[Stat] Buffer Cache Hit
[System] TSM Usage (Total)
[System] PGA Usage (Total)
[Stat] Redo Log Size
[Stat] Physical Reads
[Stat] Logical Reads
[Stat] Hard Parse Count
When the users click the settings icon in the upper right corner of the Layout Tab area, the users can set whether to enable Auto Refresh and the interval in seconds.
When the users click the Add Tab icon at the top of the Layout Tab area, a new Layout Tab is added.
Users can apply an existing Layout or a newly created Layout to the new tab.
When the users click the Save button at the top of the Layout Tab area, the current Layout changes applied to the tab are saved.
This feature is only available for layout created by the user. Common users without Custom permissions cannot use this feature.
For the Default layout, the Save function is not available, so the button is disabled as shown below.
When the users click the Cancel button at the top of the layout Tab area, the Layout applied to the current tab is restored to its previous state (the last saved state). Changes made are not saved.
Clicking a specific instance name in the instance list at the top of the layout Tab area disables the corresponding instance in the current Lathe layout Tab. Clicking the instance name again restores the instance graph to the chart.
Log Time
Collection Time
Tablespace Name
Tablespace Name
Used/Total Size [Byte]
Used Temp Size / Total Temp Size (Unit: Byte)
The users can view detailed information about sessions that used Temp for one hour for the selected item in Total Temp Usage.
SID
Session SID
Serial #
Serial number
User Name
Session user name
When the users click Sid in Session Temp Usage, the users will be taken to the Temp Detail page.
On this page, the users can view the usage and change in Temp usage in minutes and seconds.
Additionally, session information can be viewed at the bottom.
Mounted On
Mount area name
File System Name
File system name
Earlier Time
Earlier Time
Later Time
Later Time
Earlier Free/Total Size
When the users click on specific data in Filesystem Usage, the users can view detailed changes in the size of the file system over time. The graph on the right allows the users to quickly grasp the amount of size change at a glance.
The following is a description of the items provided in the Filesystem Info screen.
Log Time
Collection time
Used
Usage
Free
Available amount
Session module name
Tablespace
Name of the Temp tablespace in use
Used/Total Size
Used Temp size status
Extents
Number of extents
Session module name
Segment ID
Segment ID in use
Used/Total Size
Used Undo Size Status
Used Block
Used Undo Blocks
Used Rec
Used Undo Records
Recovery
Recovery Size
Alert Trigger
Alert Trigger Name
Instance
Name of the instance where the alert occurred
Confirm
User confirmation status
User Comment
Message content written by the user when confirming notifications
Physical Block Read Count
Physical Block Writes
Physical Block Write Count
Single Block Reads
Number of Single Block Reads
Free/Total Size
Available File Space Status
Used/Total Size
Used File Space Size Status
Total/Auto Extend Limit Size
File auto-extend maximum increase size status
Auto Extend
File auto-extend status
Statistics
View statistics metrics
Wait Class
View the list of wait classes during the analysis period and the wait time values for each wait class
Wait Event
View detailed information about the selected item in the wait class
Note
Due to an issue with the Tibero library used to collect SQL execution history, some information such as Machine, Module, Program, Username, and OS User may not be collected.
When the child number of an SQL trace is 0, it indicates that the SQL plan allocation failed for various reasons. Additionally, if the execution time up to the point where the SQL plan generation fails exceeds the SQL_STAT_HISTORY_THRESHOLD set by the user, the SQL trace with the failed SQL plan generation is collected. In conclusion, when the child number of a collected SQL trace is 0, there is no mapped SQL plan, so the SQL plan cannot be viewed.
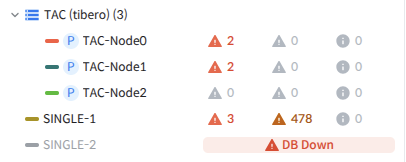
An area that displays the status of DB instances included in the monitored group and the current status of alerts for each instance.
Each instance is assigned a color and, in the case of TAC/TSC clusters, is grouped together and deployed.
In Instance Overview, the users can see the status of each instance at a glance. \ If an Alert item appears in the right-hand Alert section, it indicates Normal status. If Agent Disconnected or DB Down occurs, the corresponding status is displayed on the right.
The users can hide or expand the Instance Overview menu by clicking the arrow button on the right.
The status of the monitored DB includes Normal, Agent Disconnected, and Down.
Normal: The DB is running, connected to the TPM Agent, and collecting metrics.
Agent Disconnected: The DB is running but is not connected to the Agent, so metrics are not being collected.
Down: Indicates that the DB instance is down or unable to establish a connection.
Super Admins can register monitoring targets by clicking the 'Import button'.
The users can view the status of alerts generated for each instance on the right side of the instance item. Clicking the corresponding button allows the users to check the status of Error/Warning alerts.
The users can select a specific instance from the Instance Overview to display only data for that instance in the Card View and Custom Area.
When an instance is selected, Auto Refresh stops in all areas of the Dashboard, and all data in all areas is frozen to the point in time when the instance was selected.
Click each instance to quickly switch to the corresponding menu or view the instance's information via Instance Info.
The drop-down menu is divided into two sections.
Recommend: Menus recommended by SysMasterDB
: Moves to the Performance Trend menu for the selected instance.
: Moves to the Instance Monitoring menu for the selected instance.
The users can access each menu in SysMaster and use its functions via the Global Navigation Bar.
The menus accessible via the GNB are Realtime, Analysis, Notifications, Manual Download, Settings, and Profile.
Session Monitoring - Monitor real-time session metrics such as logical reads, physical reads, and execution counts.
Server Monitoring - Monitor OS-level resource usage, such as CPU and memory usage, and resource consumption by process with filter options.
Instance Monitoring - Monitor selected instances in real time with customizable chart layout the users set.
- Monitor tablespace usage and status with hourly updates and real-time data collection.
- Automatically collect database file usage every hour, with real-time updates available when needed.
- Monitor temporary tablespace usage to detect inefficient queries or excessive resource usage.
- Monitors undo usage for sessions with uncommitted transactions.
Monitor session lock information with a tree view and terminate blocked sessions as needed.
- Visualize the TSC cluster topology and monitor database roles, status, and TSN details.
- Analyze long-term performance trends using graphs and time slice functions.
- Analyze the top SQL statements that are the main causes of high resource usage.
- Visualize resource usage by time period using heatmaps and drill-down analysis.
- Compare and analyze changes in SQL execution plans (SQL Plans) over a specified period.
- Monitor session connection trends and real-time session status.
- Tracks SQL statements that triggered Hard Parse events.
- Track system and user-defined alert history.
- Tracks the number and details of invalid database objects.
- Tracks changes in tablespace size over time.
- Tracks changes in the size of the server's filesystem.
- Tracks changes in segment size over a specified period.
- Monitors changes in the size of temporary tablespaces by time.
- Tracks changes in the size of the undo tablespace over time.
- Generate and analyze performance reports at the instance or cluster level.
- Generate and view ASH reports for active session analysis.
Click [Realtime] > [Usage Monitoring] > [Tablespace Usage] in the global navigation bar to open the Tablespace Usage page.
The Tablespace Usage page displays information about tablespace usage.
The users can view the tablespace usage and status information for the monitored database. The default collection interval is 1 hour, but the users can use the [Collect] button in the upper-right corner to collect and display real-time information for the specified time.
In the Last 24 hours history, the users can view the usage information to date in grid format or check the trend of changes in chart format.
In Segment Size, the users can view the size of each segment type within the Log Time selected from the Last 24 hours history. The collection unit for this information is 1 hour.
Click the [Realtime] > [High Availability Monitoring] > [TSC Monitoring] menu in the global navigation bar to open the TSC Monitoring screen.
The TSC Monitoring screen displays the TSC list, network configuration for each TSC, recovery status charts via TSN, and real-time status of the Primary DB and Standby DB.
The users can set the automatic refresh interval. The users can refresh immediately by clicking the [Refresh] button.
The users can view the TSC list.
The users can view the TSC network configuration.
Click the [Overview] button to view the TSN chart and monitor the recovery status.
The users can monitor the status of the Primary DB and Standby DB in a table format.
By clicking on each instance name in the Primary Database or Standby Database, the users can view the Instance info in the right-side panel.
The following is a description of the items provided on the Primary Database screen.
The following is a description of the items provided in the Standby Database screen.
Click the [Analysis] > [Usage Analysis] > [Undo Usage] menu in the global navigation bar to open the Undo Usage screen.
This screen displays the changes in Undo size by time unit for the specified period.
The users can view detailed information about the total Undo usage of the selected items in Undo Usage.
The users can view detailed information about sessions that used Undo for the selected item during the specified time period.
When the users click Sid in Session Undo Usage, the users will be taken to the Undo Detail page.
On this page, the users can view the usage and change in undo usage in minutes and seconds.
Additionally, session information can be viewed at the bottom of the page.
Click the [Analysis] > [Usage Analysis] > [Segment Usage] menu in the global navigation bar to open the Segment Usage screen.
The users can select the date the users want to view. The Segment Usage list for the selected period shows a simple overview of usage increases and decreases.
This screen shows the changes in size for each segment name during the specified period.
The following is a description of the items provided in the Segment Usage screen.
This section describes the Layout settings available in the Layout Tab area of the Instance Monitoring page.
The layout Settings feature is available to users with Super Admin and Admin permissions.
Common users can only use this feature if they have been granted Custom permissions by an Admin user.
to ensure no information is lost in normal conditions. QSIZE, as mentioned above, represents the number of entries and must be an integer value. If the result of the division is a decimal such as 0.01, set QSIZE to 1 or higher (an integer greater than or equal to 0.01) to prevent data loss. Refer to the manual for the ranges of FREQ and QSIZE.
Additionally, even if QSIZE is set to the recommended value, data collection may be missed under heavy load conditions. For example, if Tibero experiences high load and the CPU resources are not available for the TPM Agent, the collection interval may unexpectedly increase. If the collection interval was previously set to 1000ms, it may be extended to 2000ms for a few seconds due to insufficient CPU resources. In such cases, even if the recommended value is set, data collection may be missed. To prepare for such situations, the users can allocate a larger QSIZE than the recommended value; however, this will consume more memory from Tibero, so it is advisable to set QSIZE based on the recommended value according to the situation.
10
Not possible
./tpmctl.sh version
TPM Agent version output
./tpmctl.sh libversion
Output the list of build patches for the TPM Stat library used by the TPM Agent and the list of patches for Tibero.
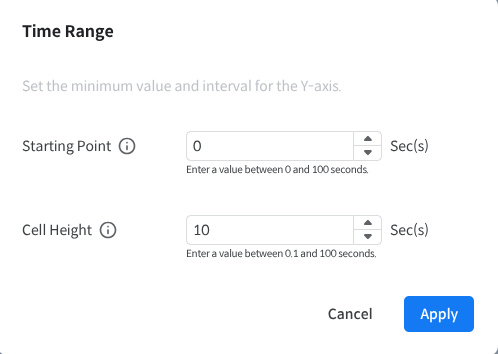
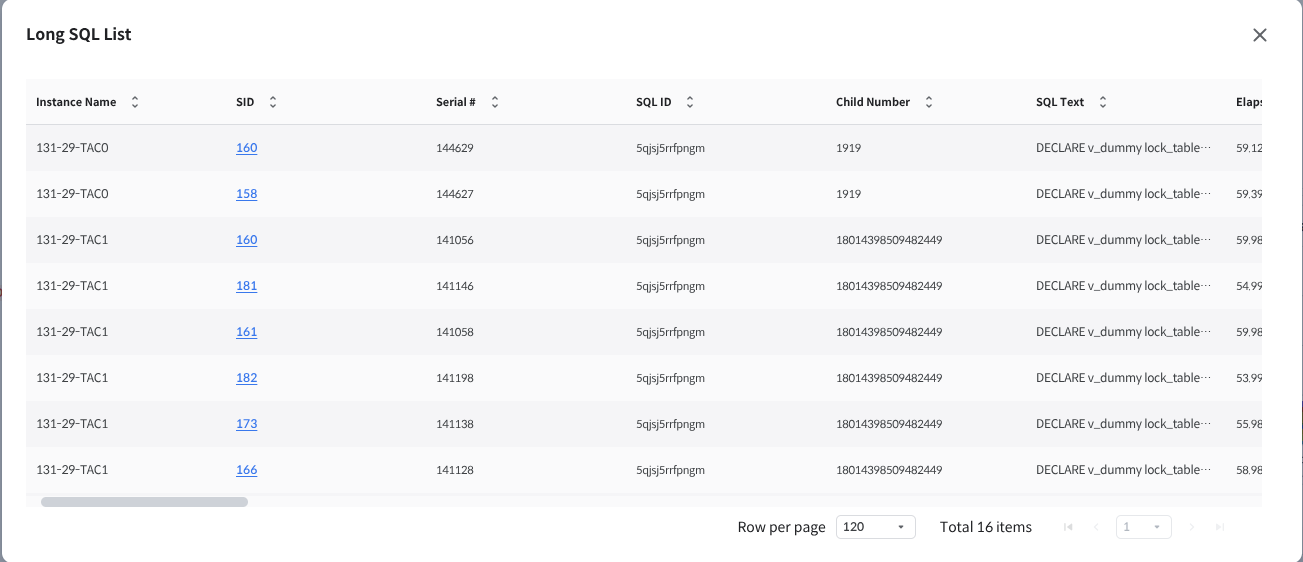
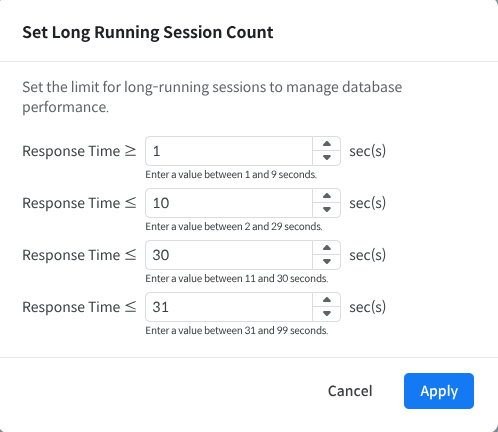
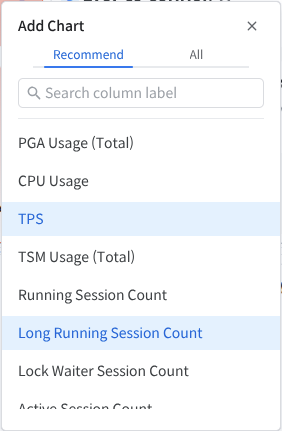
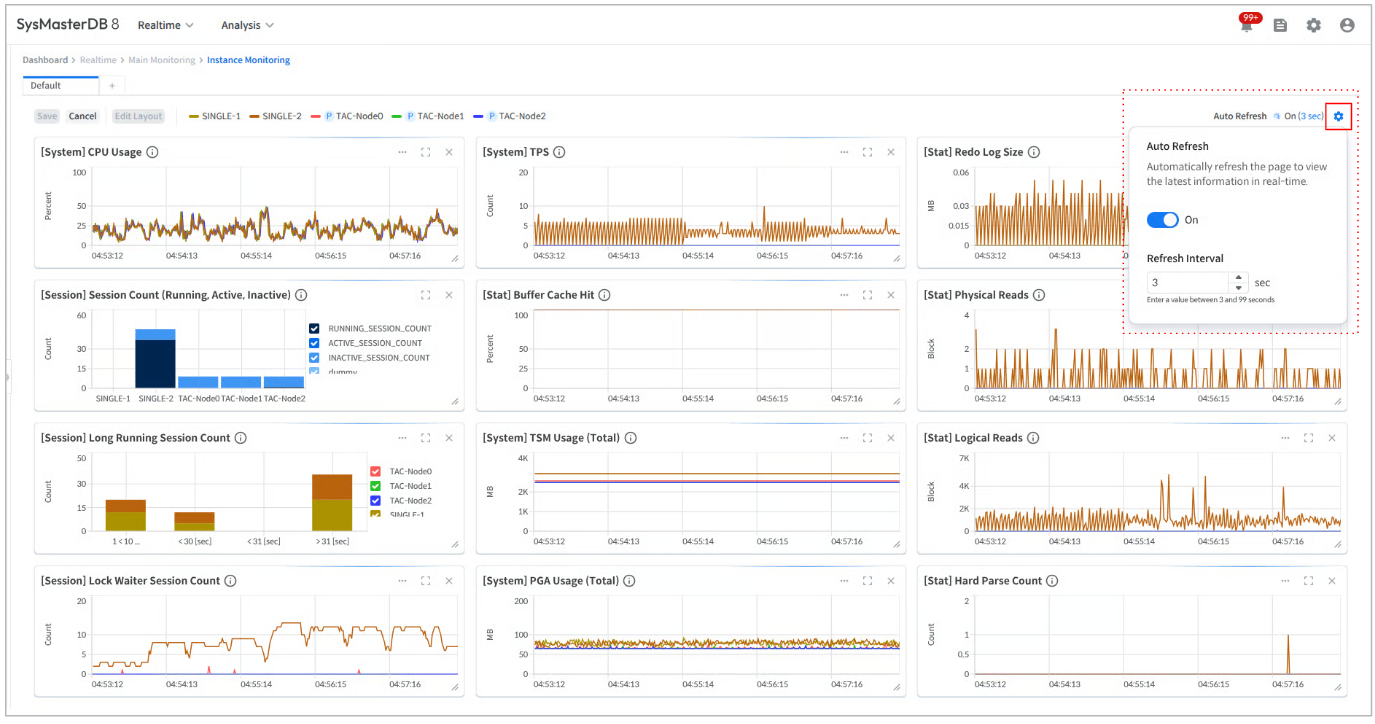
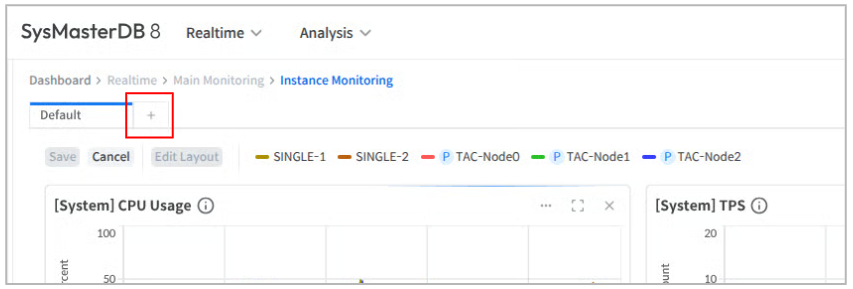
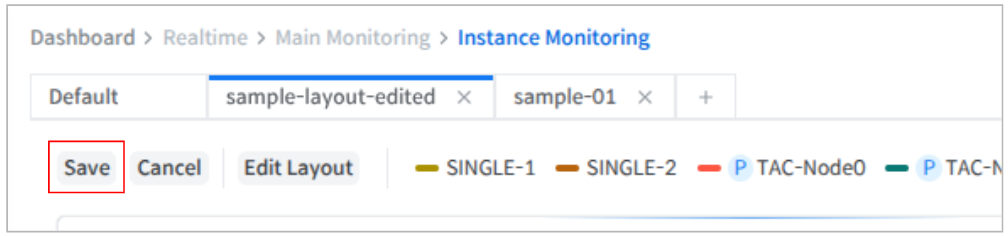
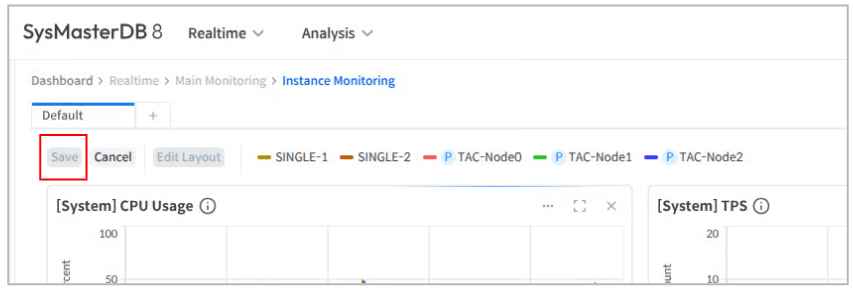
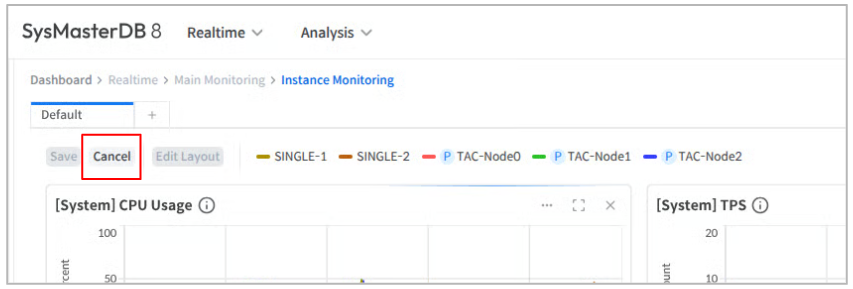
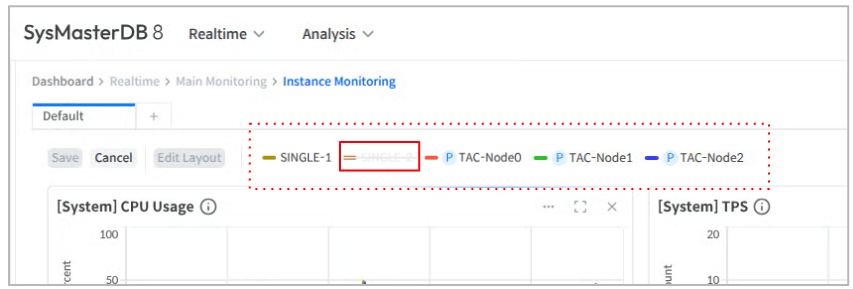
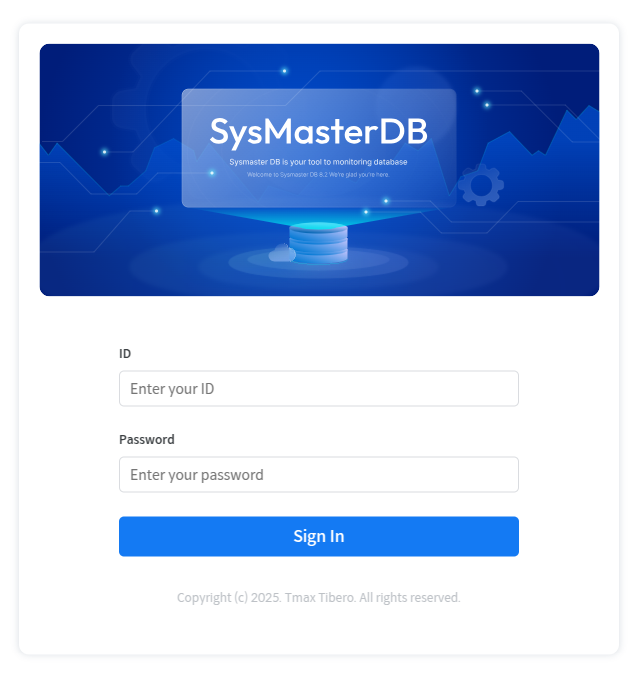
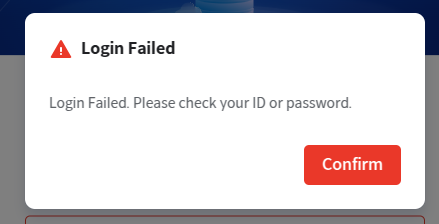
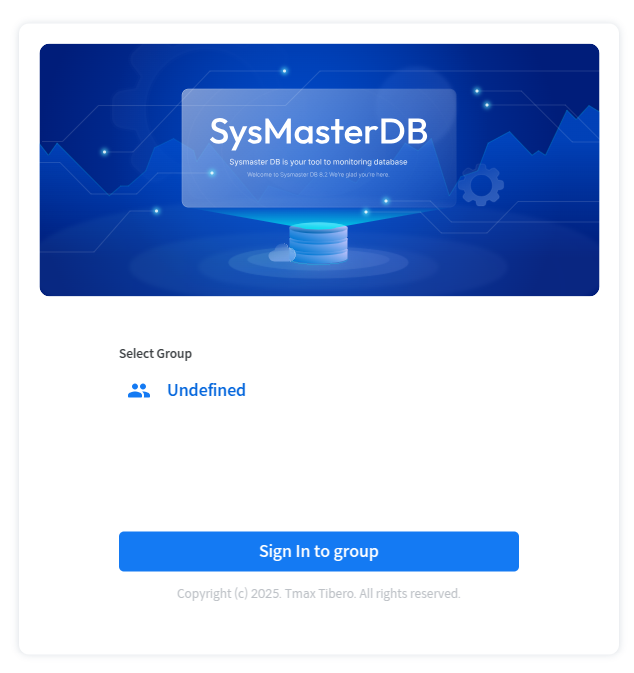

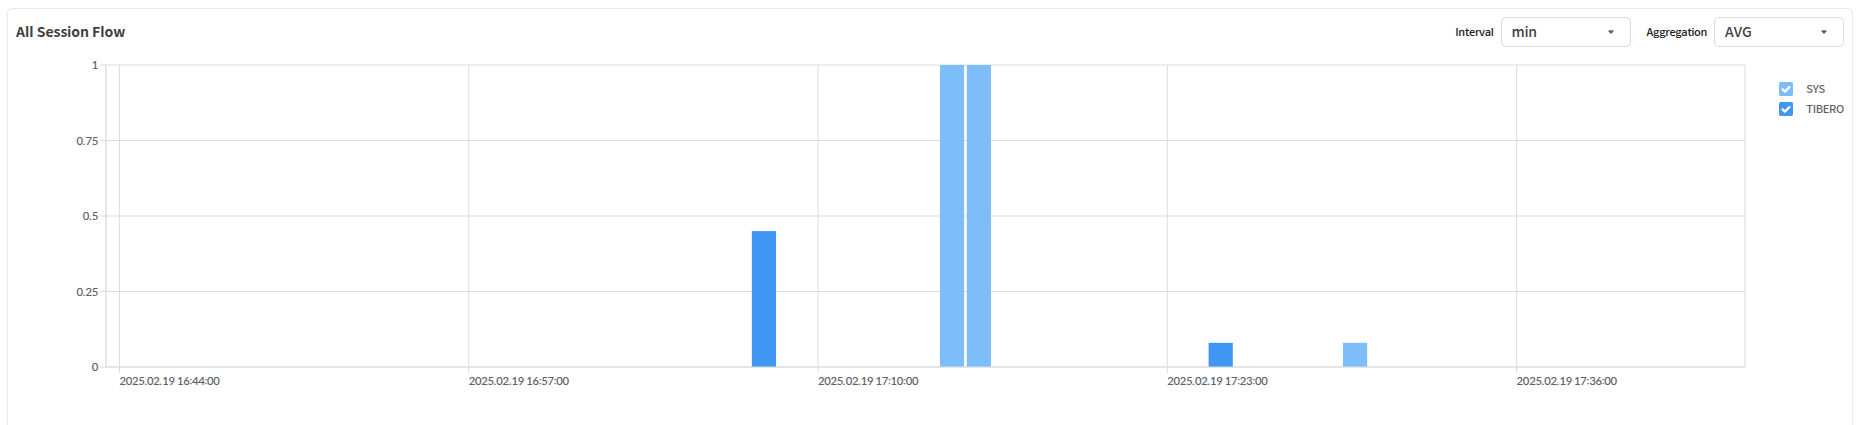
All
: Creates an alert.
: Provides detailed information about the monitoring DB instance and equipment.
Note
If connection attempts to the registered instance fail for 1 minute, SysMasterDB considers the DB instance to be in the Down state. Once the connection becomes available again, it is automatically recognized and switched to the Normal state.
Caution
If TPM Agent data collection and transmission are paused due to firewall settings changes or other reasons, no indicators may be visible in the Normal state. Therefore, if real-time indicators are not visible in the Normal state, it is necessary to check the monitoring DB machine and TPM Agent logs.
Note
Go to Alert Events
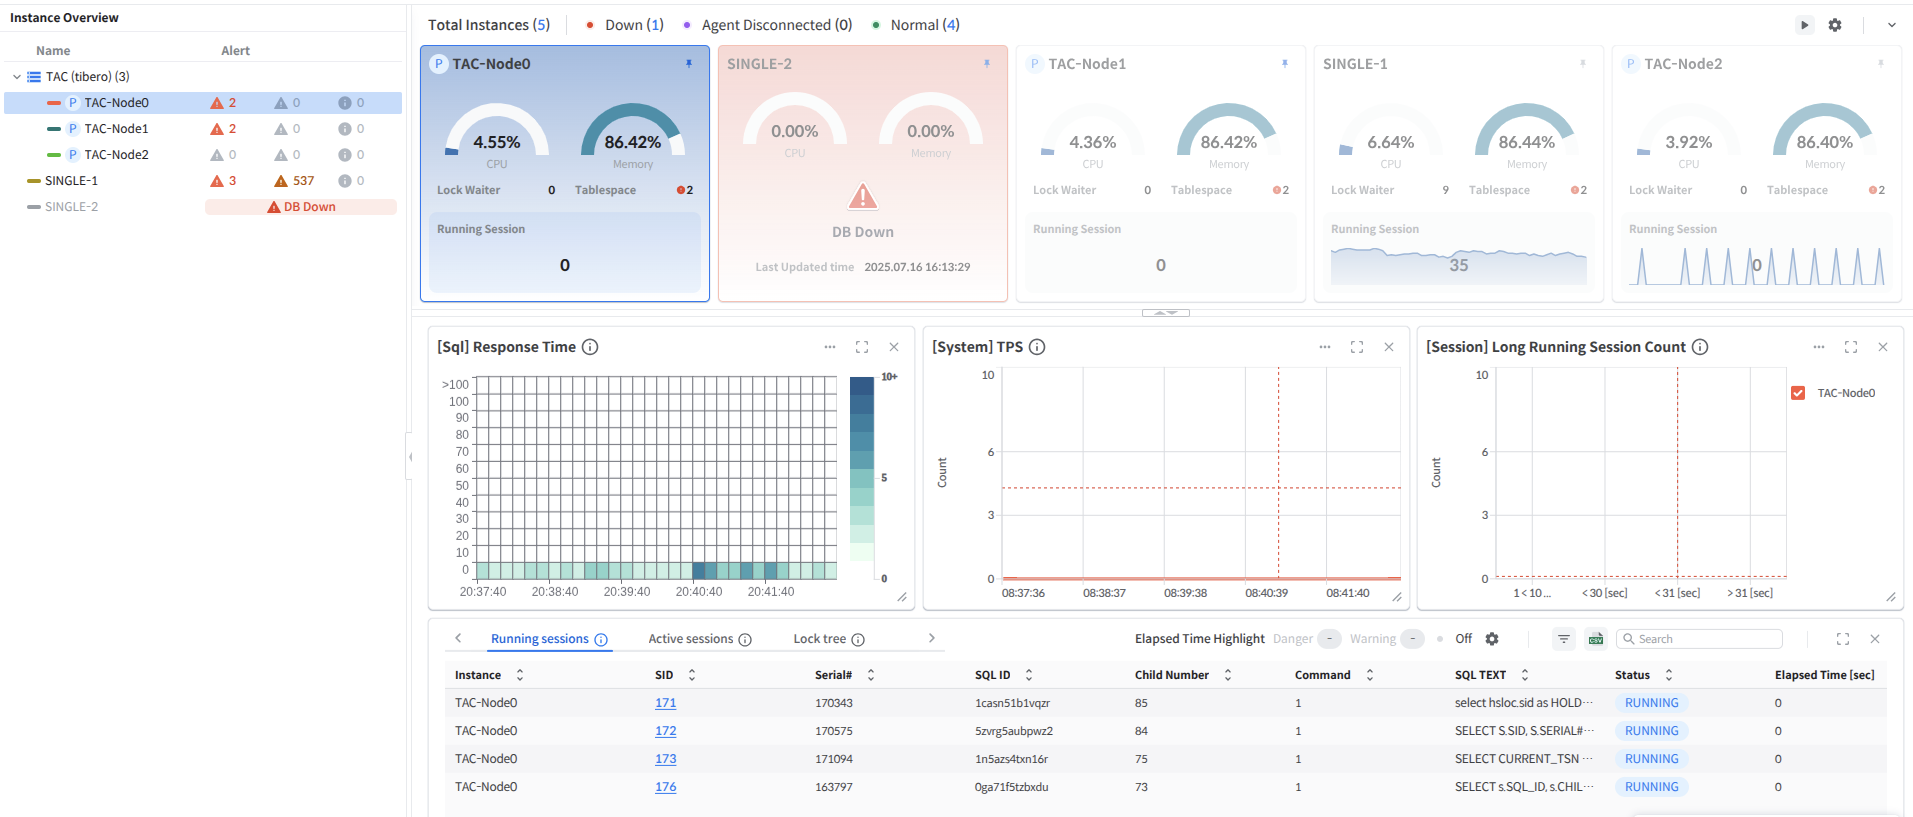
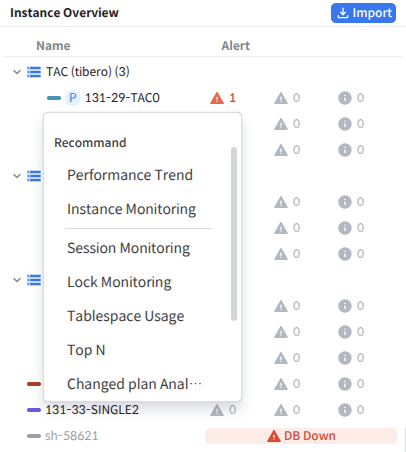
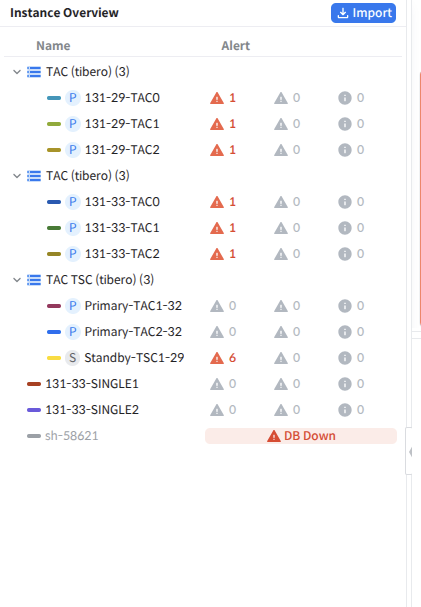
Partition Name
Partition Name
Used/Total Size
Ratio of space occupied by the segment
Tablespace Name
Tablespace name
Status
Current status of the tablespace
Contents
Table Space Types
Permanent
Undo
Free/Total Size
Table Space Free Space Status
Used/Total Size
Table Space Used Space Status
Extent Management
Extent Management Method
Allocation Type
Extent Allocation Method
Segment Space Management
Segment Space Management Method
Auto Extend On
Whether any of the data files in the table space are in Auto Extend mode
Log Time
Collection time
Free/Total Size
Free space status of tablespace
Used/Total Size
Usage status of tablespace
Segment Type
Segment type (Table, Index, Undo, etc.)
Owner
Owner account
Segment Name
Segment Name
Note
The larger the segment size, the more it is affected by load. Even if the users click the [Collect] button in the upper-right corner of the Tablespace Usage page, this information is not collected and is instead collected every hour on the hour.
Memory
Current total memory usage of the instance (%)
Failover
If the instance is a failover primary instance, displays the time when the failover occurred
Replication Mode
Indicates the data replication behavior between the Primary DB and Standby DB
(possible values: PROTECTION, AVAILABILITY, PERFORMANCE)
Role
PRIMARY
STANDBY
SNAPSHOT STANDBY
Log Transport
Log transport mode
LGWR SYNC
LGWR ASYNC
ARCH ASYNC
CPU
Current total CPU usage (%) of the instance
Memory
Current total memory usage (%) of the instance
Last Received Log
The most recent Redo Log received from the Primary
Last Applied Log
The most recent Redo Log applied (recovered) to the Standby
TSN Diff
The difference between Primary Database and TSN
Instance
Instance name
Current Log
Most recent Redo Log
CPU
Current total CPU usage (%) of the instance
Instance
Instance name
Status
The status of the standby. If there are multiple statuses, only one is displayed, followed by +n. If there are multiple primary nodes, the network status with the first node is displayed.
Value type
PRIMARY NOT CONNECTED
PRIMARY CONNECTED, RECOVERY NOT STARTED
PRIMARY CONNECTED, STARTING RECOVERY
READ-ONLY STANDBY, RECOVERY IN PROGRESS
STANDBY, RECOVERY IN PROGRESS
READ-ONLY STANDBY, RECOVERY SUSPENDED
STANDBY, RECOVERY SUSPENDED
PRIMARY DISCONNECTED, FINISHING RECOVERY
Unknown
Open Mode
MOUNT
RECOVERY
READ WRITE
READ ONLY
READ ONLY WITH APPLY
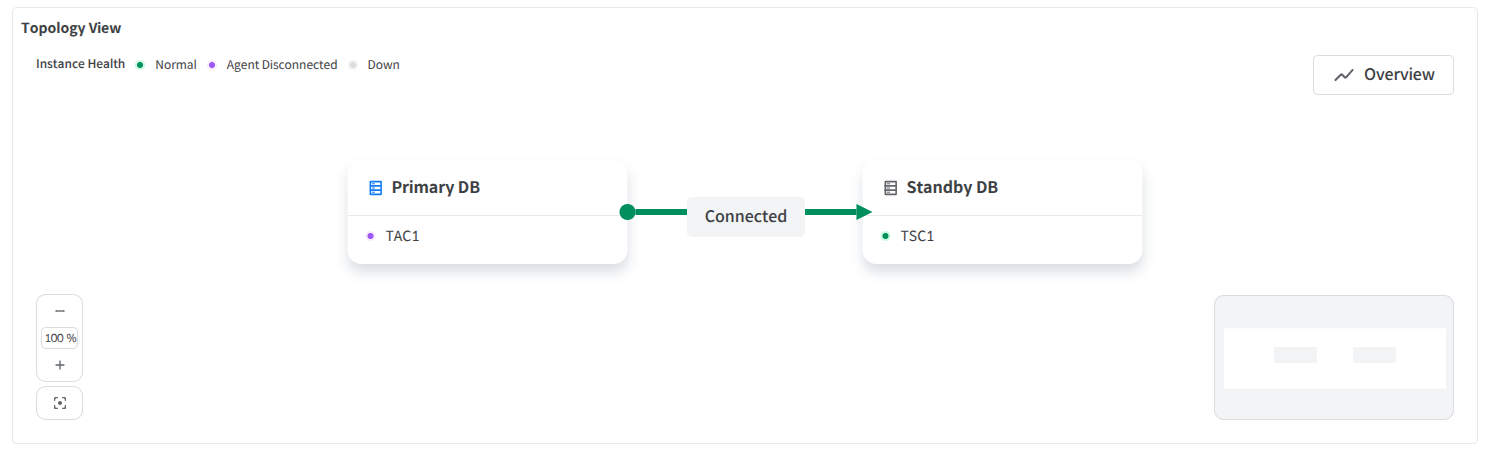
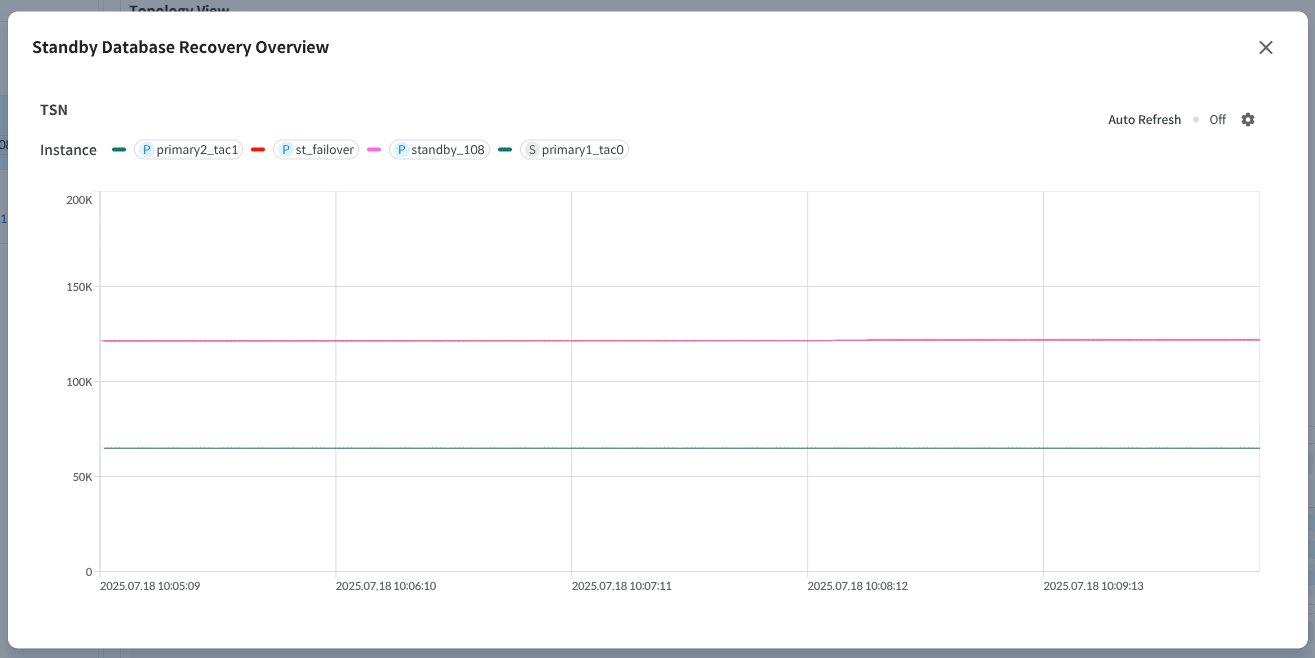
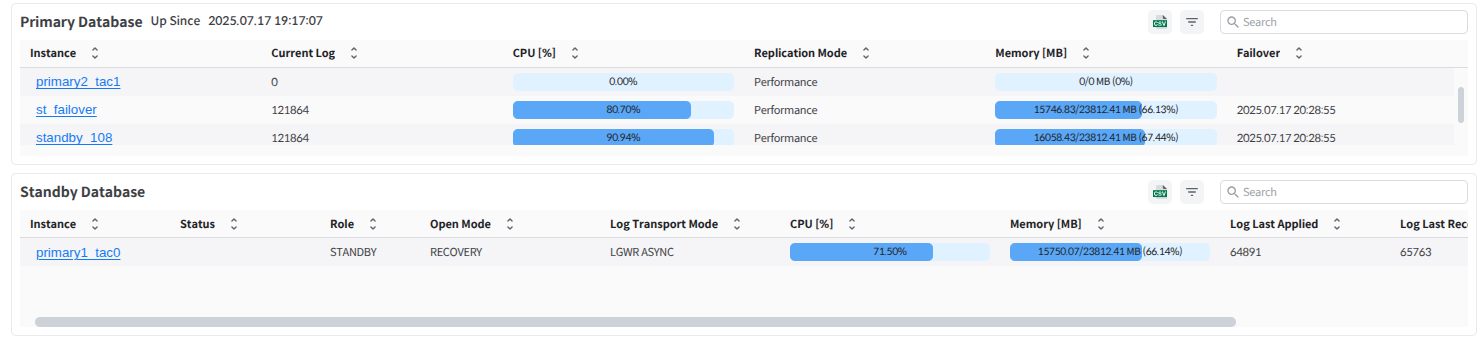
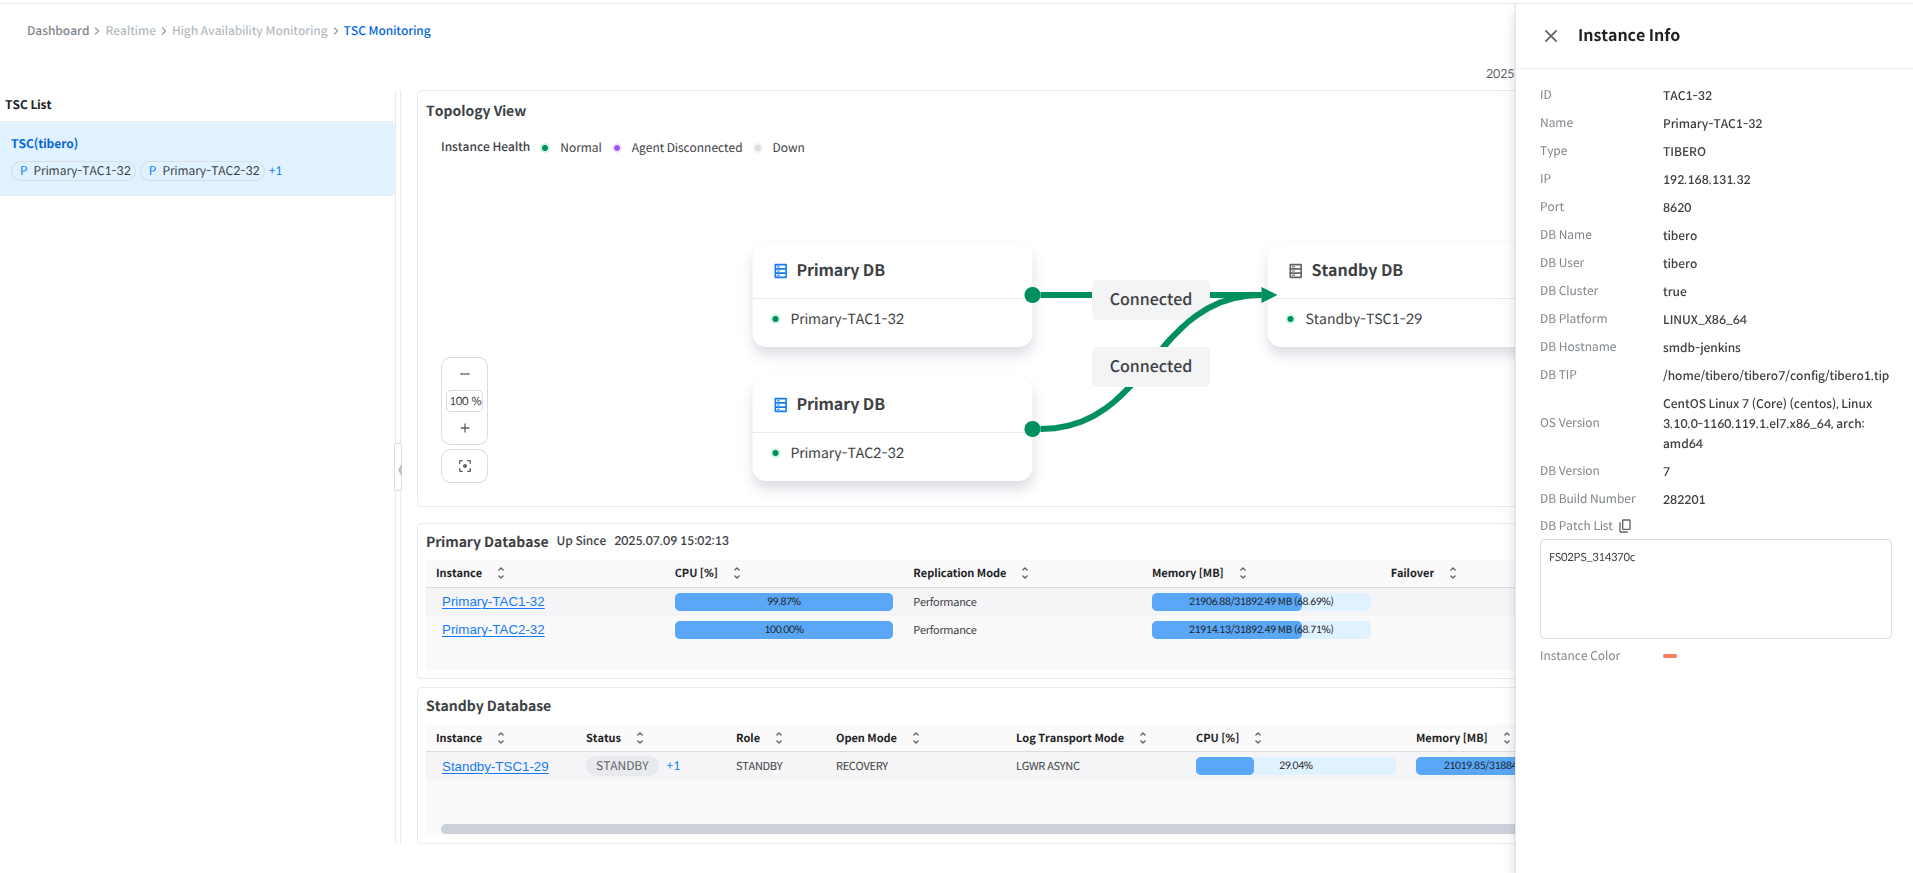

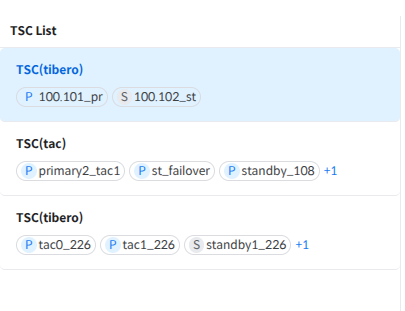
Program
Session program name
Max Used
Maximum Undo Size
Avg Used
Average Undo usage size
Max Segment Block
Maximum number of segment blocks
Avg Segment Block
Average segment block count
Log Time
Collection time
Tablespace Name
Tablespace name
Used/Total Size
Used undo status
SID
Session SID
Serial #
Serial number
User Name
Session user name
Earlier Time
Previous time
Later Time
Subsequent time
Earlier Size
Size at the previous time
Later size
The Segment Usage Header provides a feature that allows the users to select filters for data retrieval
The users can sort by the desired column using the drop-down box to the right of Order by.
Use the drop-down menu to the right to set the number of top items the users want to view.
When the users click on specific data in Segment Usage, the users can view detailed changes in the size of the segment by date. At the same time, the users can quickly grasp the size changes at a glance using the graph on the right.
The following is a description of the items provided in the Segment Info screen.
Log Time
Collection time
Partition Count
Number of partitions
Size
Size
Session holder and waiter information
Session Status
Session status
Session
Session user name
Module
Session module name
Program
Session program name
Machine
Host name of the session
IP
User IP address of the connection
SQL ID
SQL ID of the SQL being executed by the session
Child Number
Child Number value of the SQL Plan being executed by the session
Wait Event
The name of the wait event for the session
Type
Lock type
ID1
Lock ID1
ID2
Lock ID2
Mode
Lock mode occupied by the holder (Waiter is always 0)
Request
Lock mode requested by the Waiter (Holder is always 0)
Wait Time
Time waited
Page Out
Number of times Page Out occurred
Memory (%)
Memory usage at the process level
Time
Time CPU has been used since startup
Command
OS command of the process
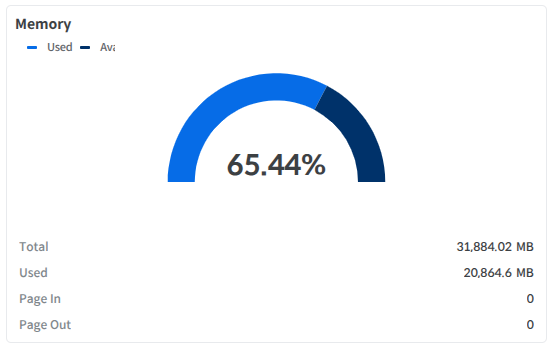
Program
Session program name
Max Used
Maximum Undo Size
Avg Used
Average Temp usage size
Max Segment Block
Maximum number of segment blocks
Avg Segment Block
Average Segment Block Count
Free space status at the previous time point
Later Free/Total Size
Free space status at a later point in time
Earlier Used/Total Size
Previous usage status
Later Total/Total Size
Usage status at a later point in time
The officially supported platforms and operating systems for SysMaster DB 8.3 are as follows.
Operating System
Linux:
CentOS 7 (64-bit)
Red Hat Enterprise Linux 7, 8.1~8.5, 8.10 (64-bit)
Docker
The hardware and software requirements for installing SysMaster DB 8.3 are as follows.
The recommended patches for the monitoring database of SysMaster DB 8.3 are as follows.

This section describes the types of monitoring metric charts available in the Layout tab of the Instance Monitoring page.
A chart that displays the real-time values of the corresponding metric for each instance as a bar graph.
Bar can be switched to a Line or Area chart.
A chart that displays the real-time values of the corresponding metric for each instance as a line graph.
Line can be converted to a Bar or Area chart, and users can directly set the line thickness using additional features.
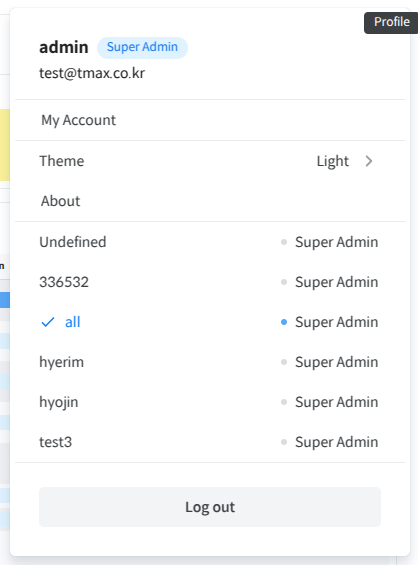
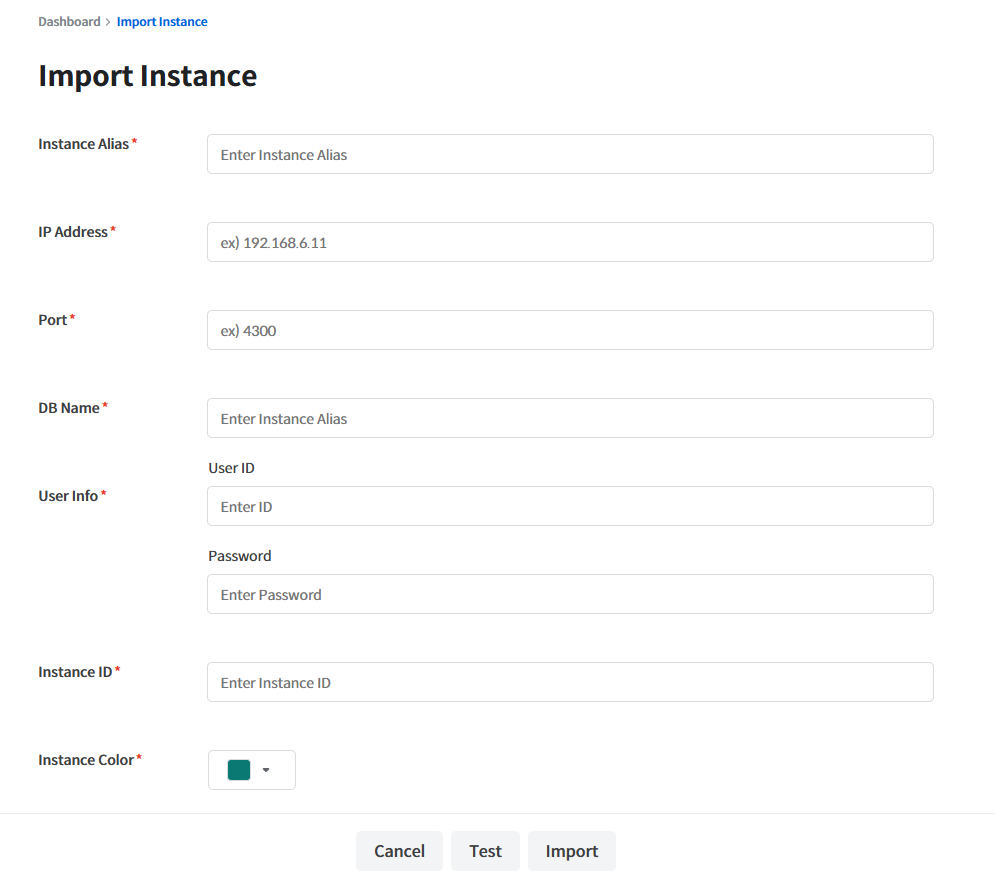

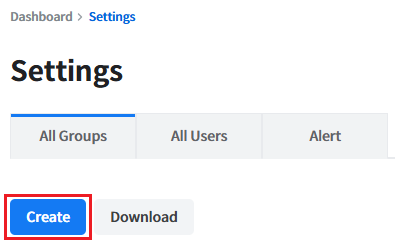
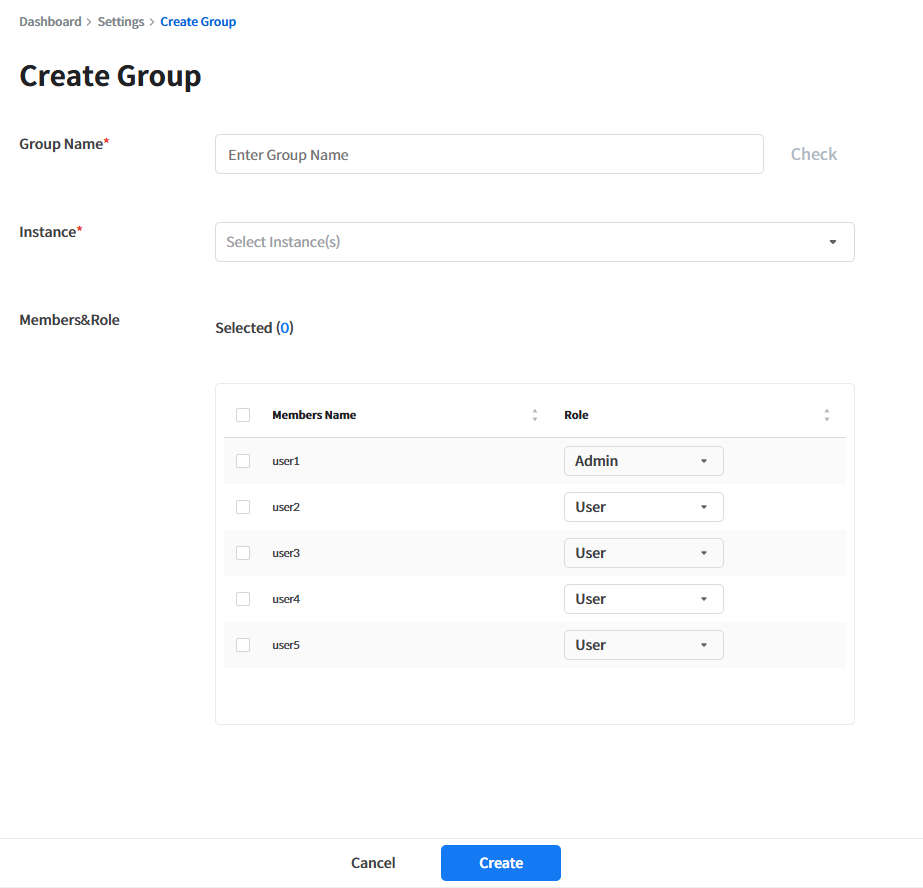

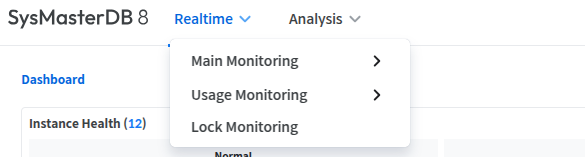
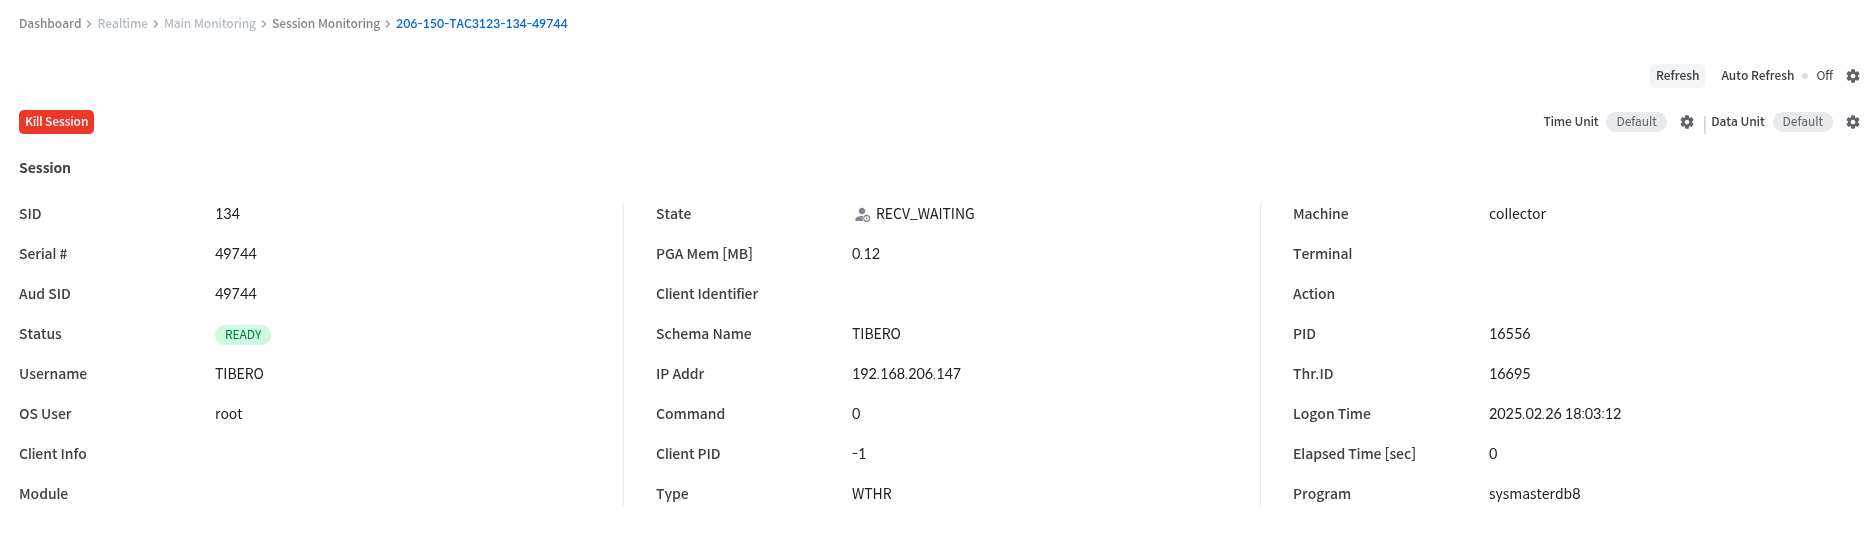

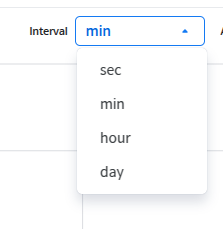

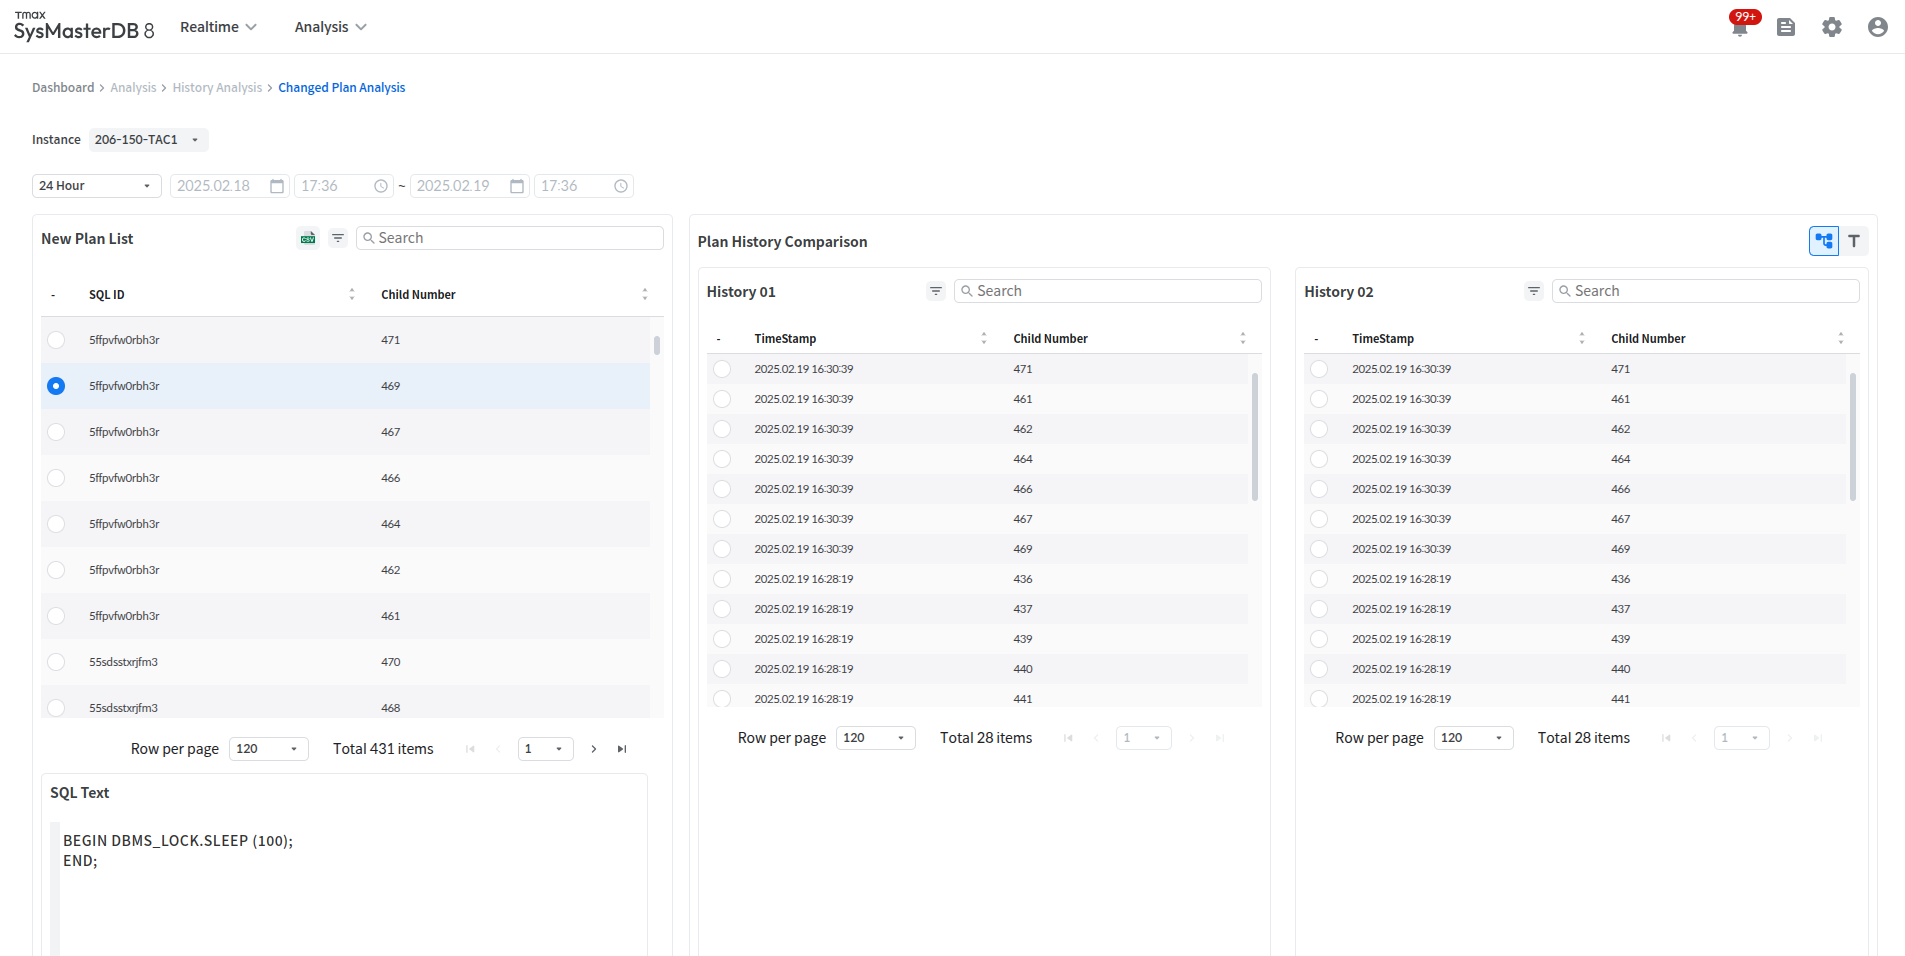
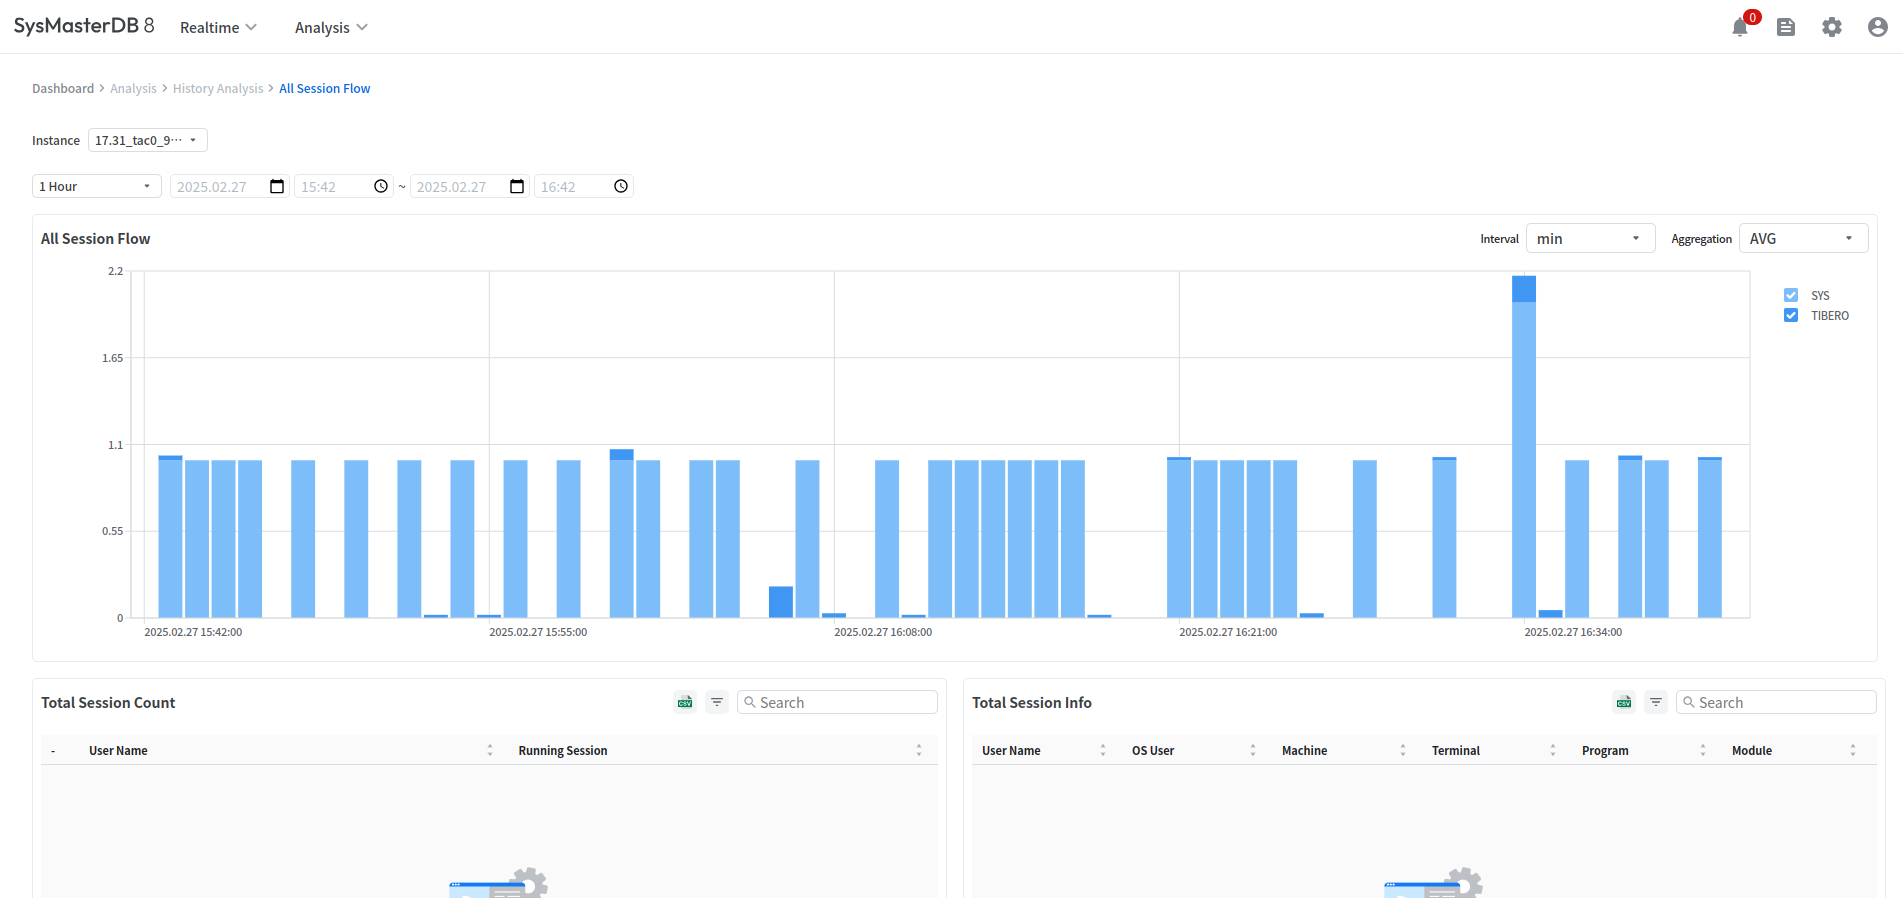
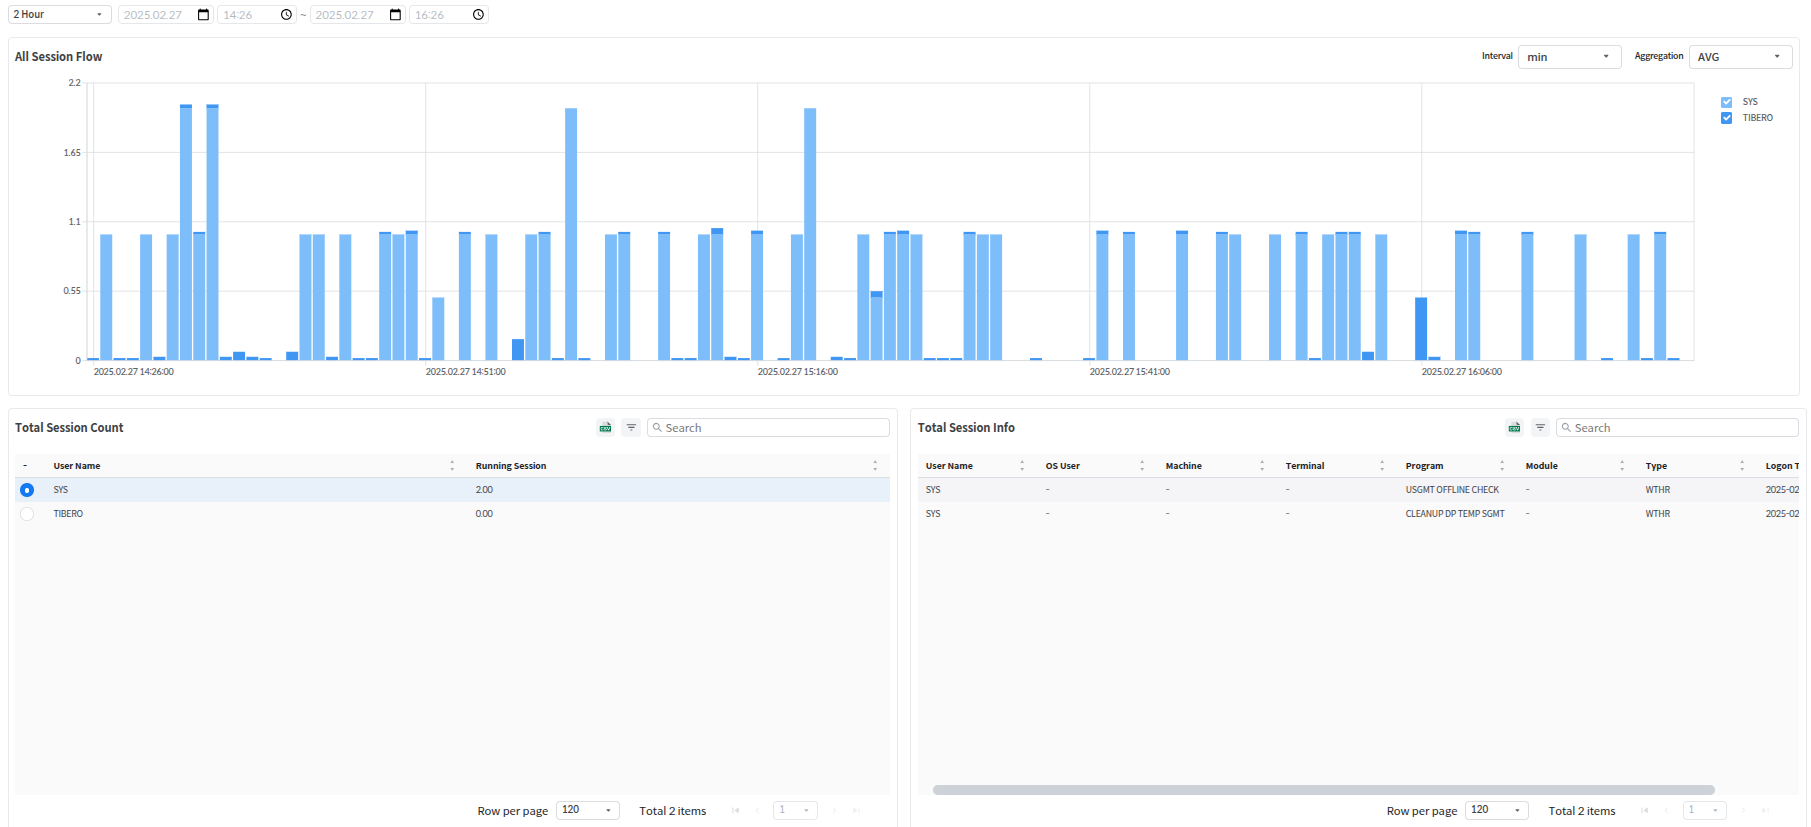
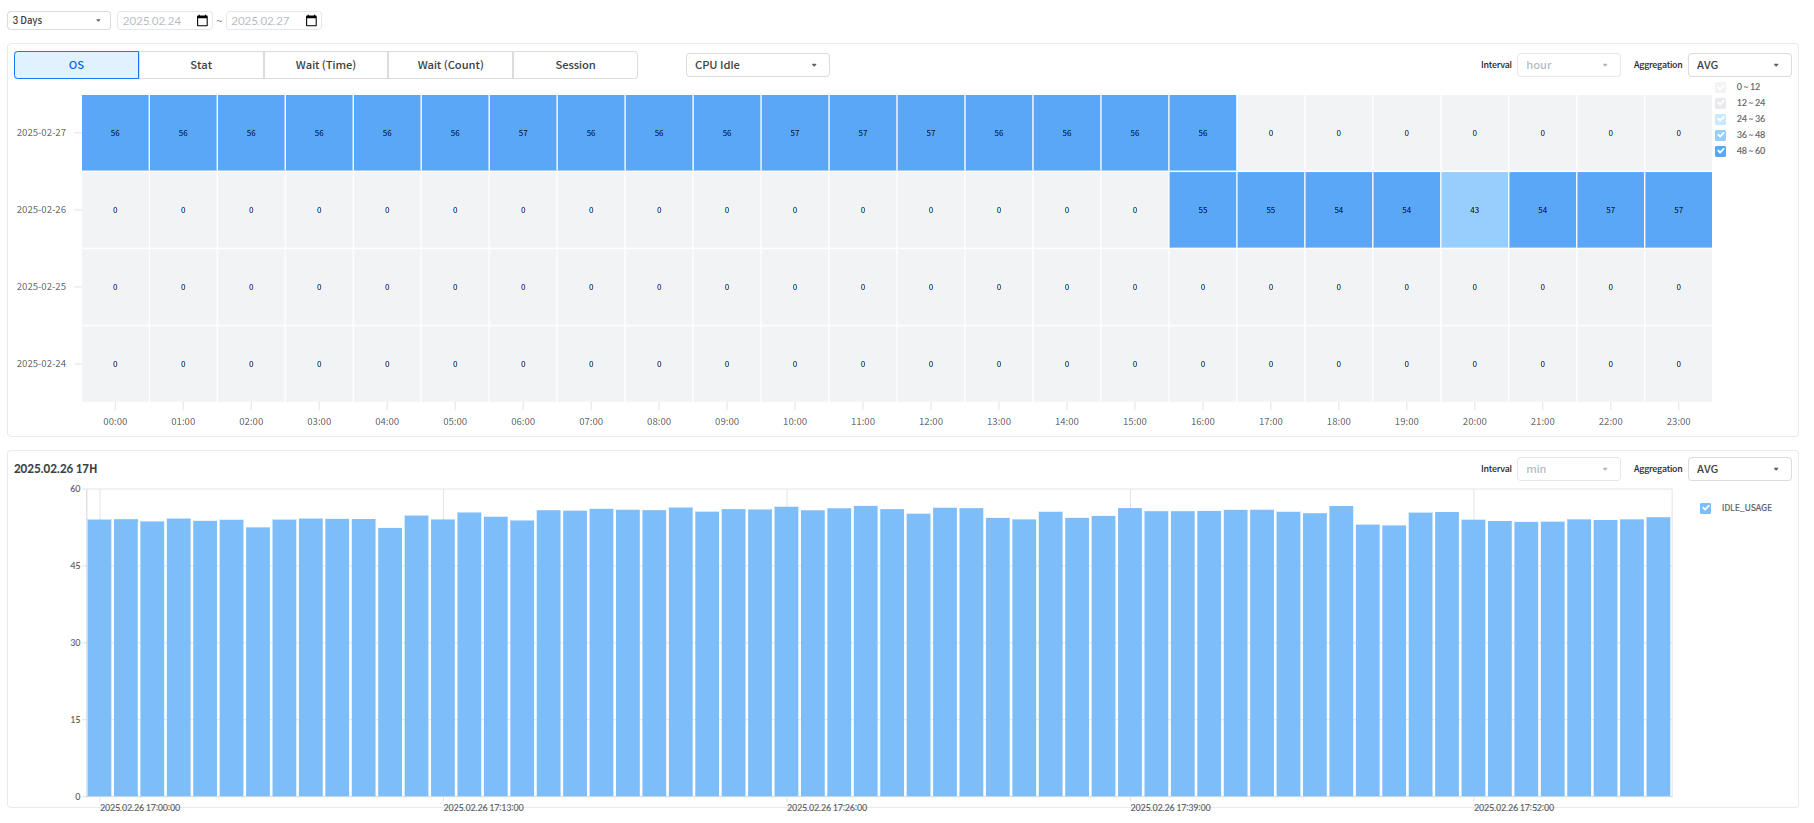
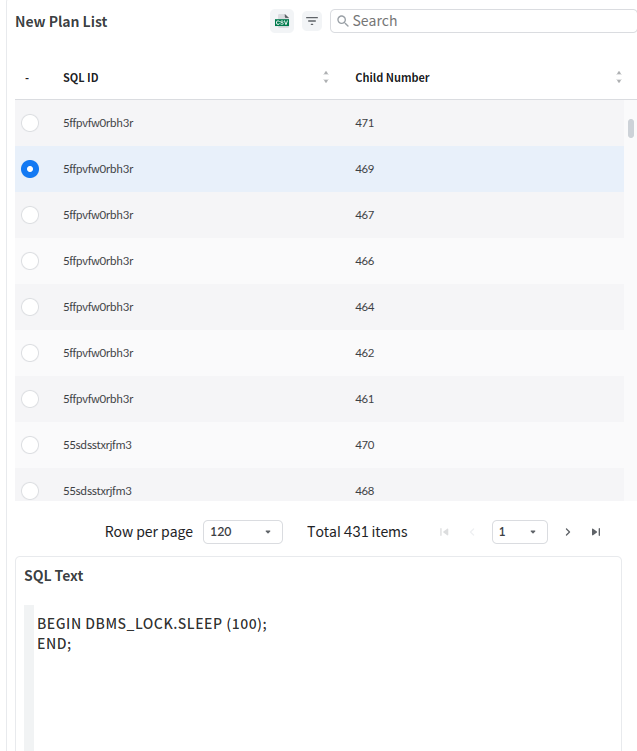
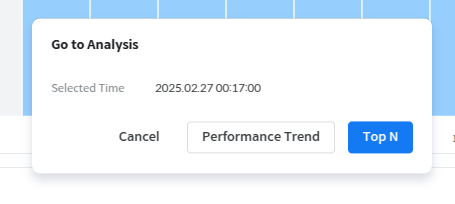
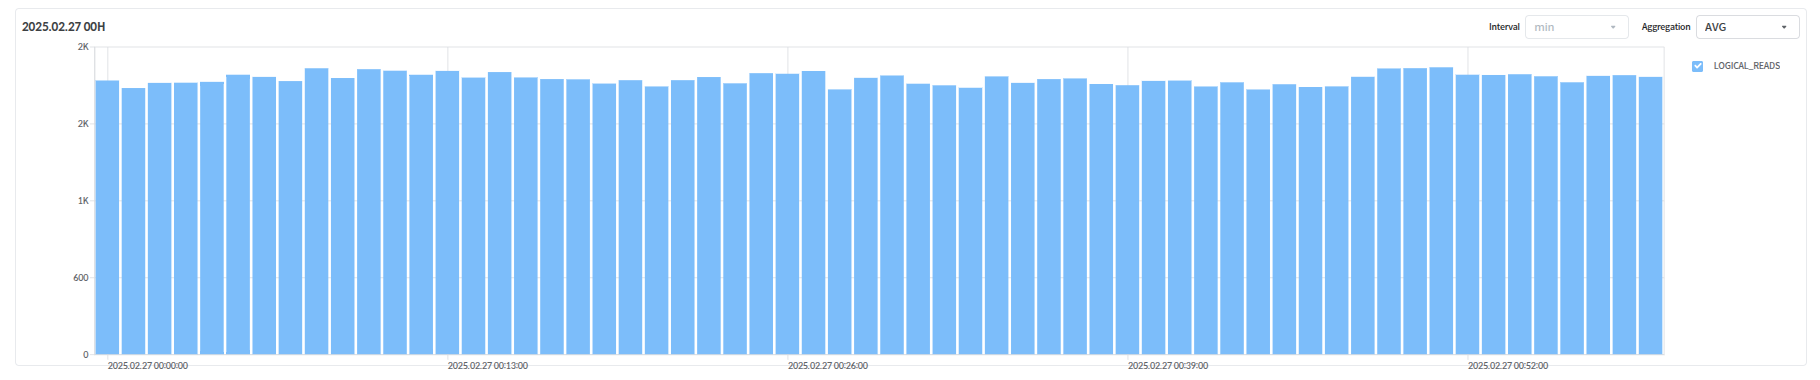
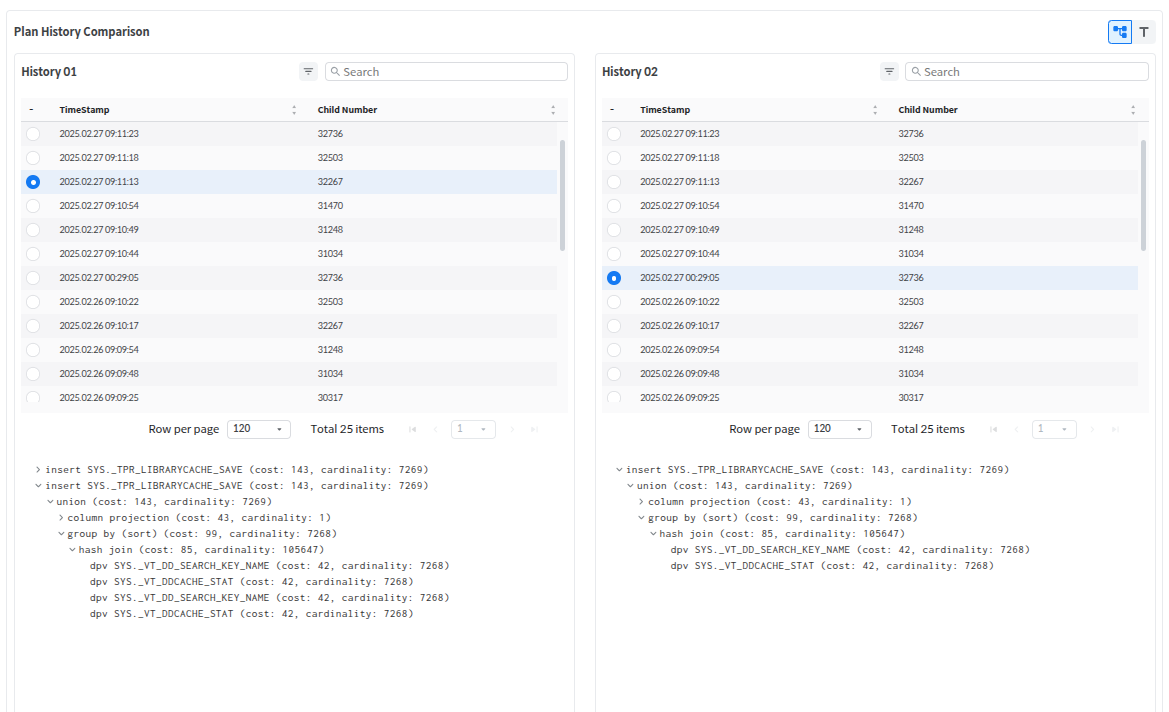
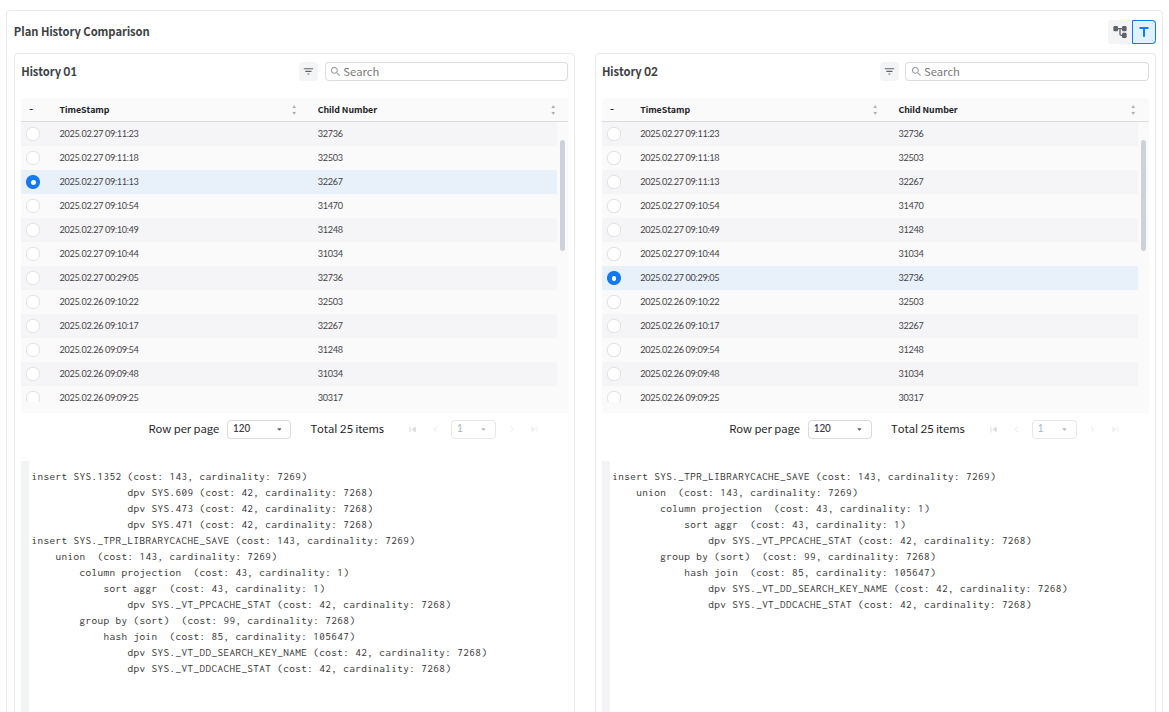
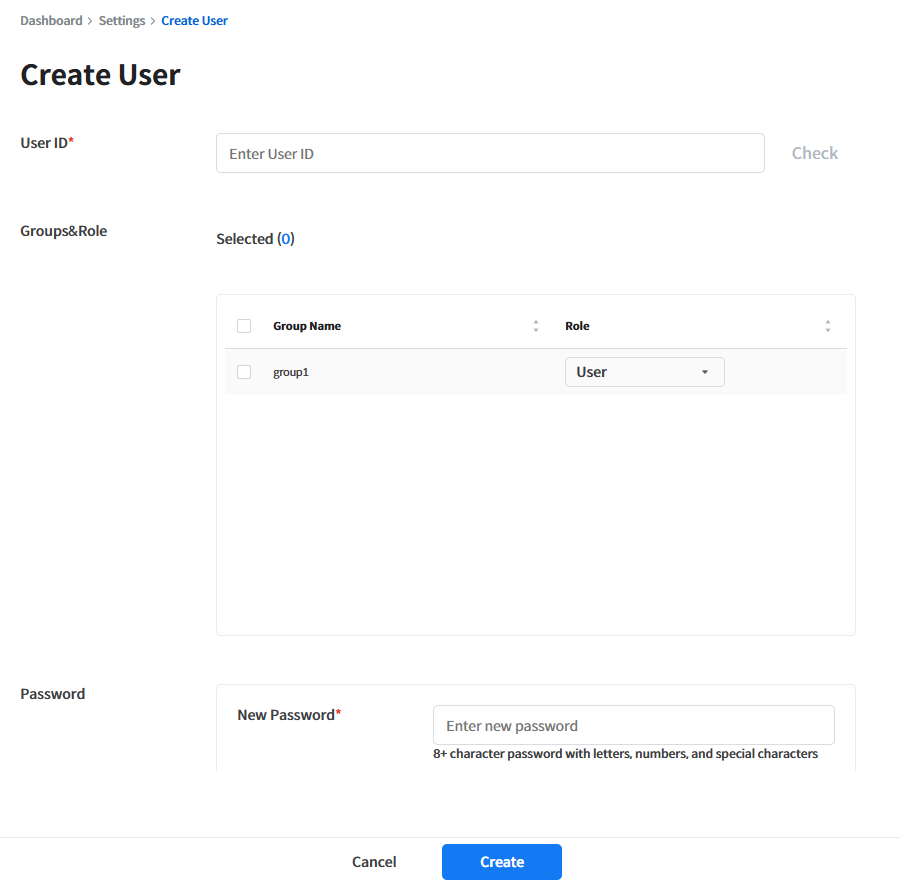
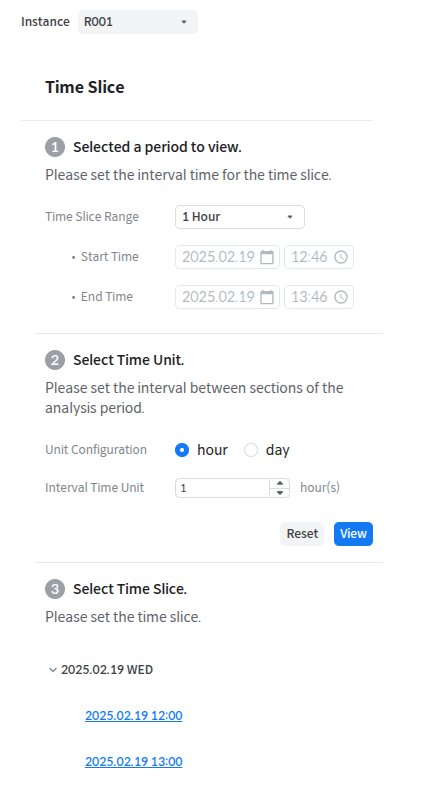


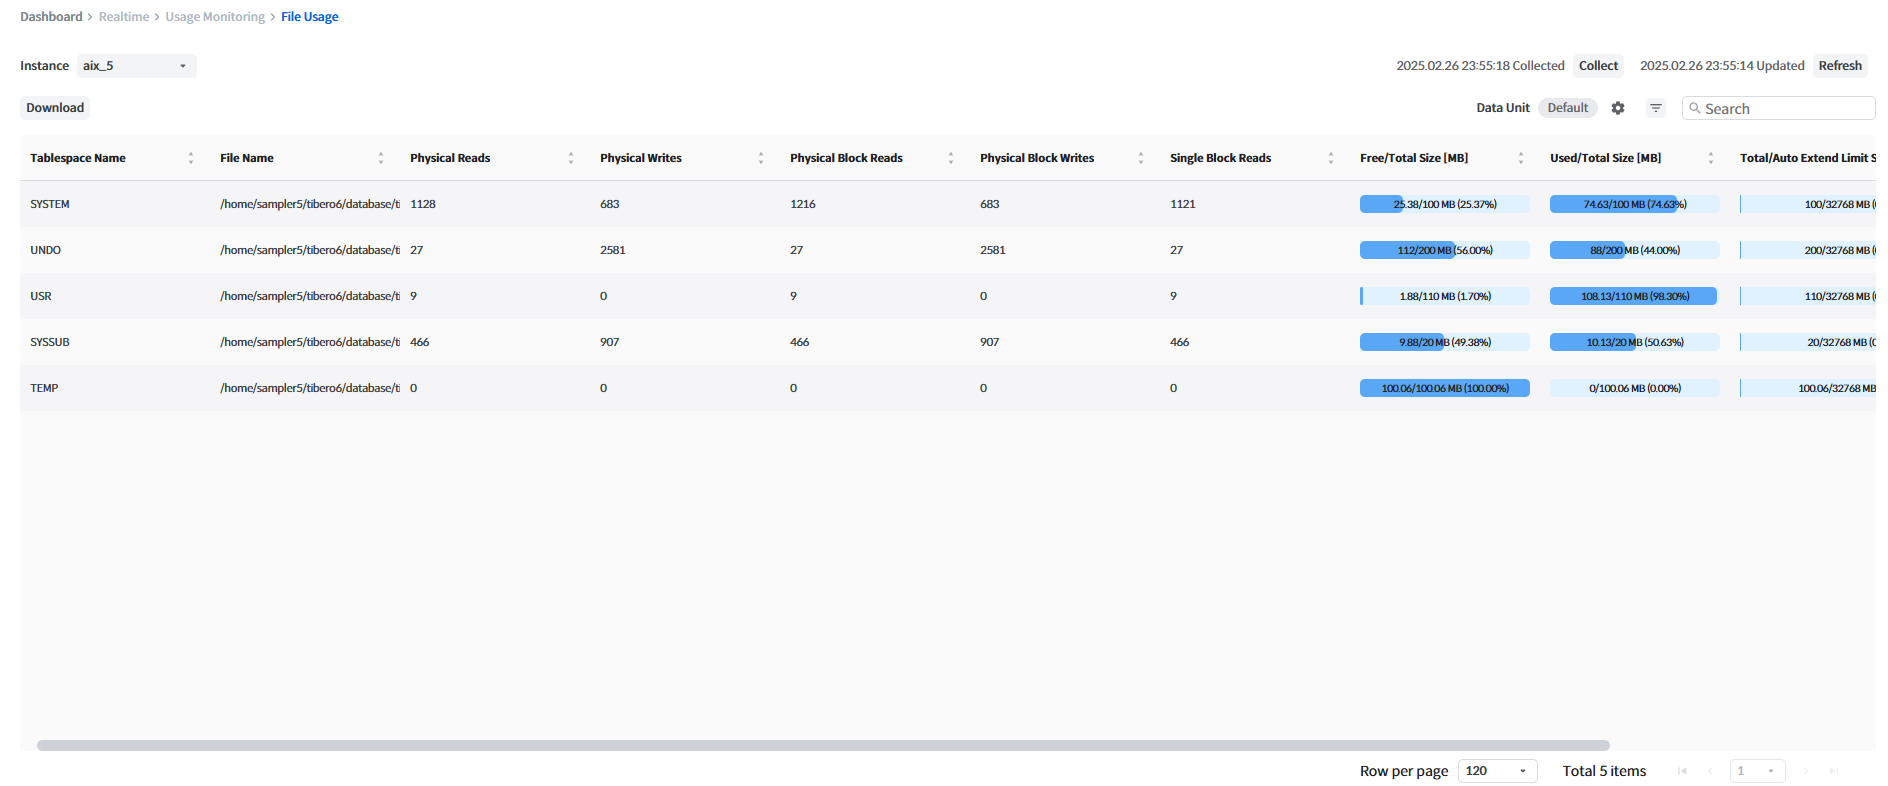
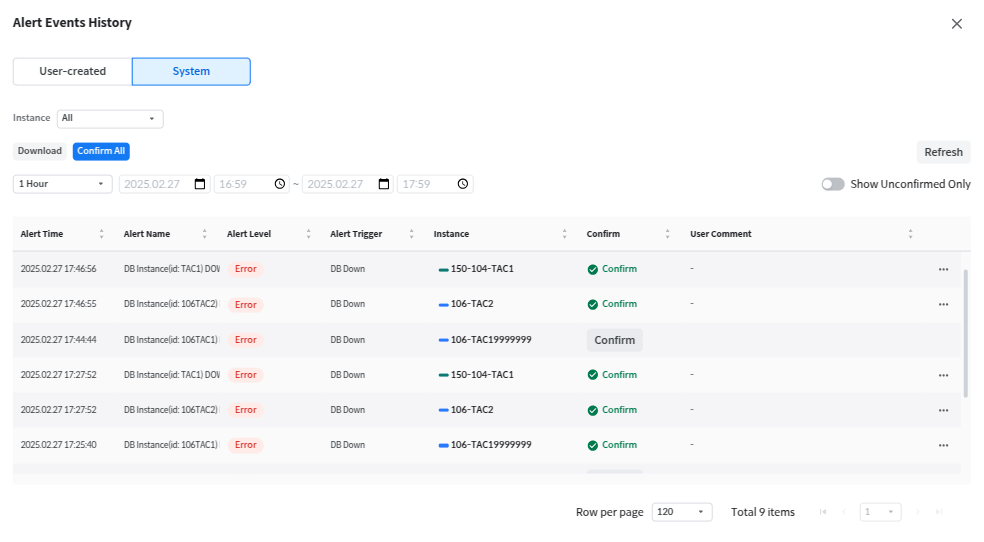
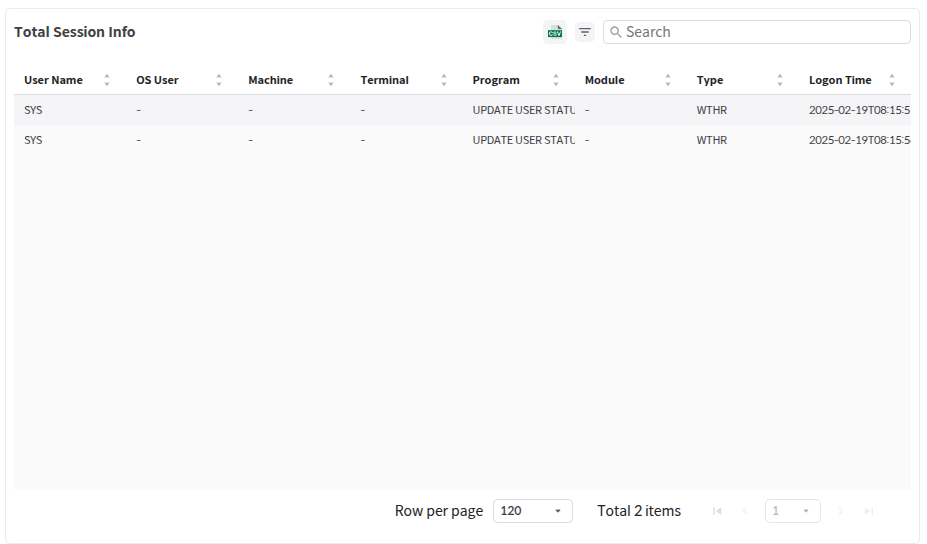
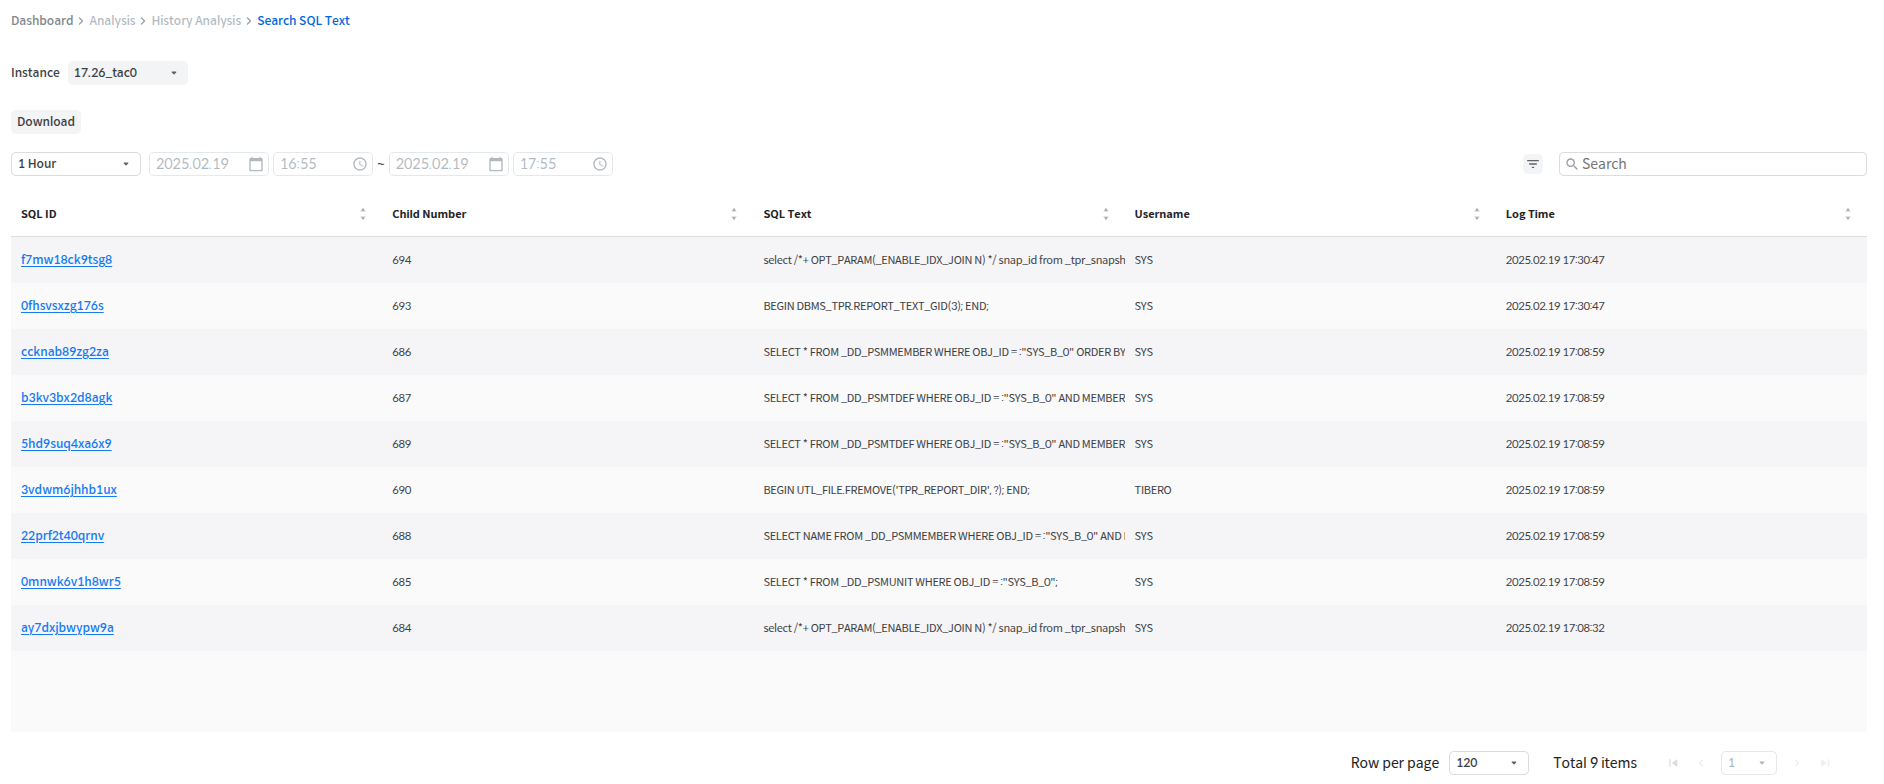
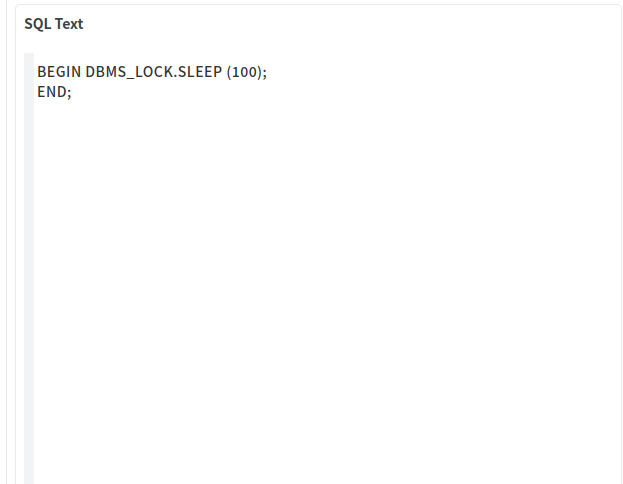
Web browser
Chrome (latest version recommended)
281081
V$TEMPSEG_USAGE view SESSION_NUMBER column value display issue improved
[Note] If the patch is not available, incorrect information may be displayed in the [Realtime] > [Usage Monitoring] > [Temp Usage], [Analysis] > [Usage Analysis] > [Temp Usage] menu.
304981b
[Note] If this patch is not applied, OS User and Machine information may be displayed incorrectly in SQL Trace information. 279651f Patch must be applied first, and is not compatible with patches below 279651e.
307175a
Fixed an issue where SQL Trace information was not collected for closed sessions.
[Note] If this patch is not applied, SQL Trace information may be significantly missing in environments where sessions are frequently opened and closed.
328607b
Fixed an issue where wait count and time were incorrectly adjusted for wait events when collecting wait count and wait time information.
[Note] Without this patch, wait time and wait count values may be displayed inaccurately.
304770a
TSC monitoring-specific patch [Note] If the patch is not installed, the information below will not be available in the V$DATABASE view, and TSC monitoring information will be displayed incorrectly, such as primary and standby not being distinguished.
338513a
This patch is required for actual TPR integration. Only the package creation script needs to be executed without server patches.
338594a
This patch fixes a bug in the Tibero package that fails to delete TPR report files created on the Tibero server during TPR integration.
[Note] The TPR integration function works even without this patch, but the report files accumulate on the server and need to be deleted periodically.
Manual deletion of report files: Periodically delete report files starting with .tpr as follows.
rm -f .tpr*
149894l
This patch is required because TPR snapshot queries use a query not supported in Tibero 6 without this patch. Without this patch, queries will not work in Tibero 6.
250728f
Patch that enables viewing the V$INSTANCE view from the standby instance. Without this patch, the instance is not clustered.
Rocky Linux release 9.5/9.6
Windows:
Windows 10 (64-bit)
Windows Server 2022 (64-bit)
Operating systems that support the installation of the following supported platforms and software requirements
v20.10 or later
Docker-compose
v2.3.4 or later
Podman
v4.4.1 or later, Linux Kernel 4.18 or later on Linux Red Hat Enterprise Linux 8 or later.
Podman-compose
v1.0.6 or or later
Kubernetes
v1.17 or later
Monitoring database
Tibero 6 FixSet06 or later Tibero 7
Monitoring database operating system
Linux:
CentOS 7 (64-bit)
Red Hat Enterprise Linux 7, 8.1~8.6 (64-bit)
Oracle Linux 8.6 (64-bit)
Rocky Linux 8.6 (64-bit)
ProLinux 7.5 (64-bit)
AIX 7.2 (64-bit)
[Note]
C++11-supported compiler
gcc (GCC) 4.8.5 20150623 (Red Hat 4.8.5-44) or later
CPU
8 Core
RAM
32 GB
Storage
30 GB or more (additional 50 GB per day may be required depending on the data retention period (RETENTION_DAY))
240373
Improved missing OS user and machine information in sessions where the program is PE_SLAVE.
[Note] If this patch is not applied, OS user and machine information will be missing in sessions where the program is PE_SLAVE.
276404
Improved issue where a new physical plan was generated each time the internal query executed when querying Tibero's global view.
[Note] In SysMaster DB 8, global views are queried every second to collect lock information. If this patch is not applied, a physical plan is generated every second for a specific SQL statement, which may cause a no response issue when querying the SQL statement in [Analysis] > [Plan Analysis], etc.
279651f
libtpmstat library creation
[Note] If this patch is not applied, the libtpmstat library must be distributed along with the TPM Agent installation. TPM Agent 8.1.3 and later are not compatible with patches 279651e or earlier, so patch 279651f or later is required. Regardless of the 279651 patch version applied to Tibero, the 279651 patch version used during TPM Agent build must match the 279651 patch version of the library.
Note
'Monitoring Database' can only be monitored for databases installed on operating systems listed in the 'Monitoring Database Operating System' list.
Note
Specifications are based on a total of 600 active sessions (60 active sessions × 10 instances).
A chart that displays the real-time values of the corresponding metric for each instance as an area graph.
Area can be converted to a Bar or Line chart.
A chart that displays the real-time values of the corresponding metric for each instance as a stacked bar graph.
Stack bar can be converted to a Grid chart, and users can directly set the range values of the metric using additional features.
A chart that displays the real-time values of the corresponding metric for each instance in a table format.
It provides real-time values of the metric for each instance by separating them into tabs, and can be converted to a Stack Bar chart.
A chart that displays the real-time values of the corresponding metric for each instance in a circular graph.
Each instance is separated by tabs, providing real-time values for the corresponding metrics.
A chart that displays real-time values of the corresponding metric for each instance in a scatter plot.
Additional features allow users to directly set the range for viewing the metric values.
For the Response Time metric displayed in the Scatter chart, users can select the desired area by dragging within the chart.
When the users drag to select an area, the SQL Trace information corresponding to each point within the selected area is provided via the Long SQL List modal.
The columns in the Long SQL List modal are as follows:
Instance
Instance name
SID
Session ID
Serial#
Serial number of session
When the users click on each item in the table of the Long SQL List modal, it navigates to the Session Detail page where the corresponding SQL Trace was executed.
Additionally, users with Super Admin or Admin permissions are provided with a Download button in the Long SQL List modal.
Clicking this button allows the users to download the table data as a CSV file.
By default, the Download button is not displayed for general users, but it can be used if the Data Export permission is granted by an Admin user.
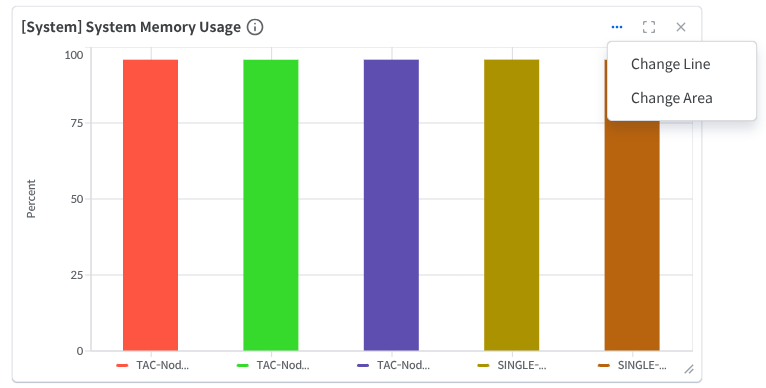
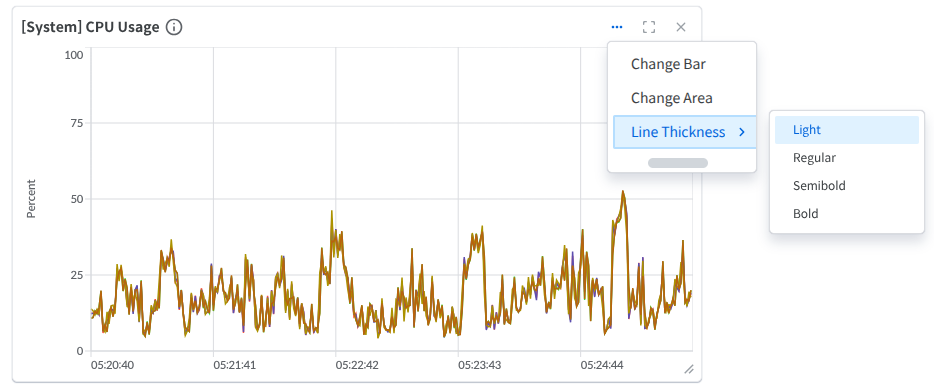
Size at a later point in time
Increment
The amount by which the size has increased or decreased from the previous point in time to the later point in time
Tablespace Name
Tablespace name
Owner
Owner of the object
Segment Name
Segment Name
Segment Type
Segment type
Partition Name
Partition Name
Earlier Extents
Number of Extents at an Earlier Point in Time
Later Extents
Number of Extents at a later point in time
Earlier Blocks
Blocks at an earlier point in time
Later Blocks
Blocks at later points in time
Blocks
Number of blocks
The process for installing the TPM Agent is as follows. However, it must be performed using the same OS account that was used to install the monitoring database.
Distribute the compressed file "tpmagent_dist_{version}.tar.gz" to the server where the monitoring database is located, then extract the compressed file.
tar -zxvf java_tpmagent_dist_{version}.tar.gzNote
The compressed installation file is approximately 150MB. Ensure that the users have sufficient space before extracting the file. During operation, ensure that sufficient space is available based on the log rotation settings.
Log file rotation involves archiving the existing log file and creating a new log file to store new logs. By default, a new log file is created every 24 hours or when the file size exceeds 50MB. Additionally, up to 7 log files are stored by default, and once the limit is reached, the oldest log files are deleted. Therefore, under the default settings, approximately one week's worth of logs are retained when only the time trigger occurs, and approximately 350MB of logs are retained when only the file size trigger occurs.
Thus, to retain all logs under the default settings, the users must ensure that there is approximately 500MB or more of space available when combining the executable file and log files.
Create the application.yml file in the directory where the "java_tpmagent_dist_{version}.tar.gz" compressed file was extracted, and apply the settings as follows:
Adjust the values of each parameter according to the YAML syntax.
agent-config:
id: "AAA1"
ip: "192.1.3.225"
port: 8292
freq: 1000
charset: "utf-8"
cpu-mem-proc-freq: 5000
disk-freq: 5000
sessioninfo-freq: 5000
dbsysinfo-freq: 5000
sqltrace-freq: 5000
log:
level: INFO
rotate-time-interval: 24
rotate-file-size: 50MB
max-log-file-number: 7
path: logs/The following is a description of the parameters set in this process.
The character sets supported by Tibero are as follows.
ASCII
EUC-KR
MSWIN949
UTF-8
The environment variables to be applied to the set.sh file in the directory where the compressed file "java_tpmagent_dist_{version}.tar.gz" is extracted are listed below. Apply the settings by creating the file as follows.
The following is a description of the environment variables set during this process.
Displays the current status information of the session and the SQL information being executed in the session.
Displays information about wait events occurring in the current session.
Wait event
The number of wait events that have occurred in the current session
Displays the full text of the SQL currently being executed in the session.
This screen allows the users to view the plan for the SQL currently being executed in the current session. The SQL plan is displayed in a tree structure.
This is the status indicator for the current session.
The items for each status indicator are as follows.
The list of status indicators is as follows:
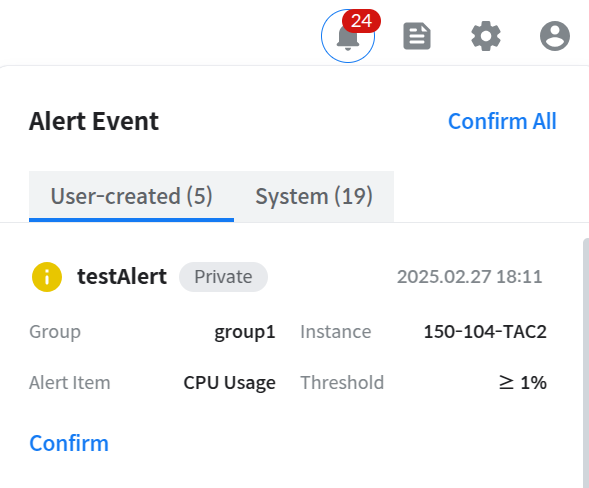
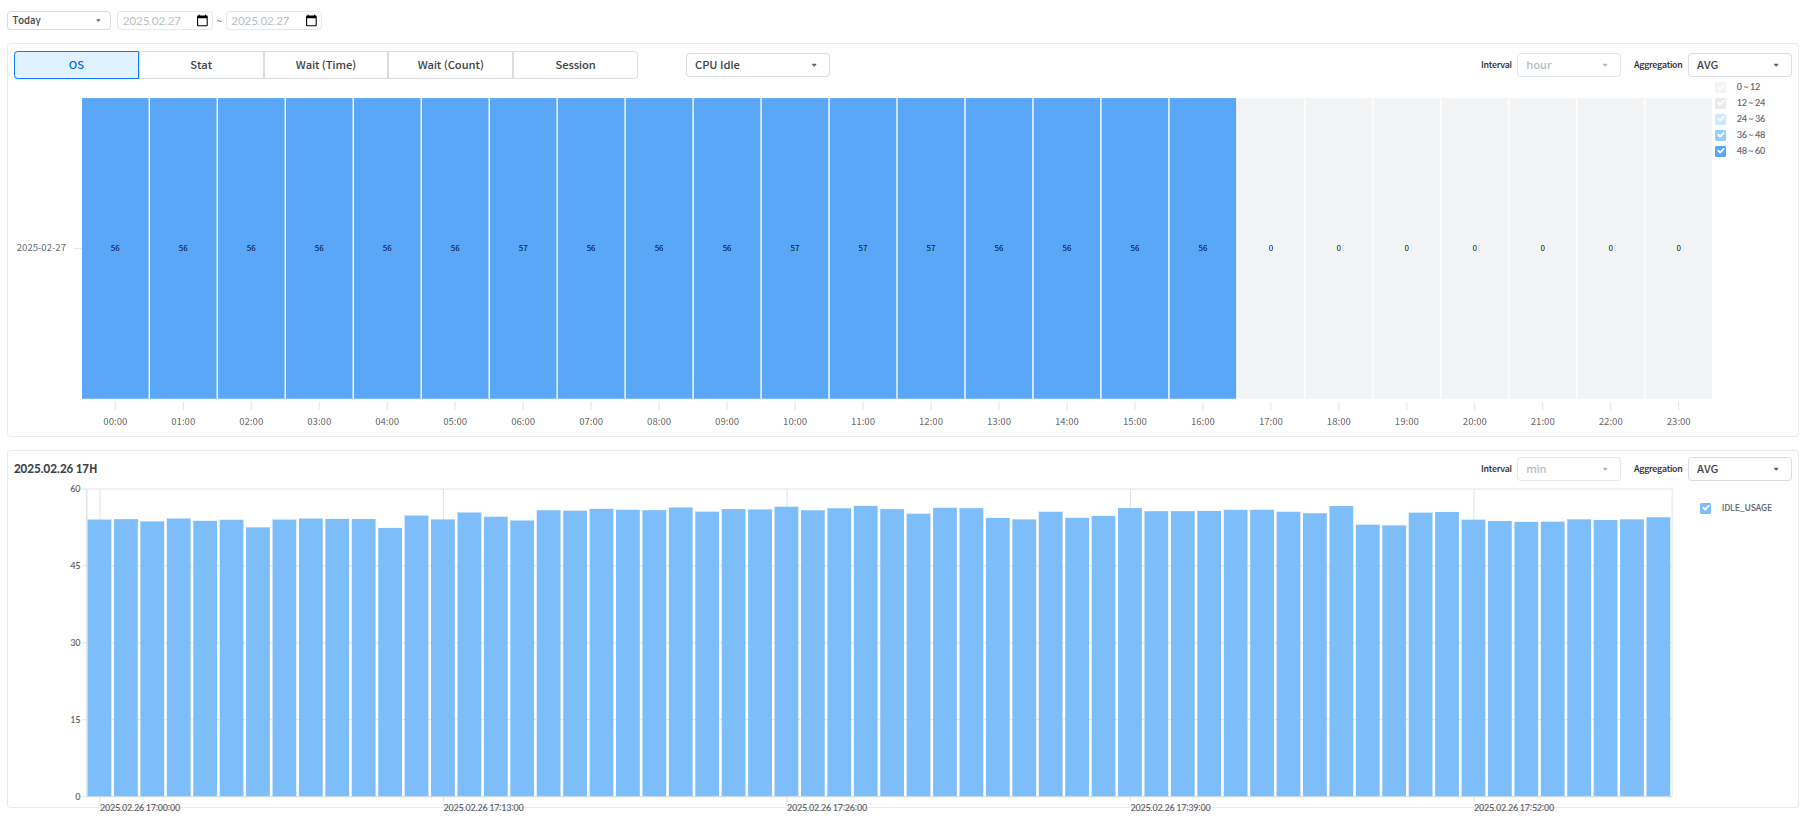
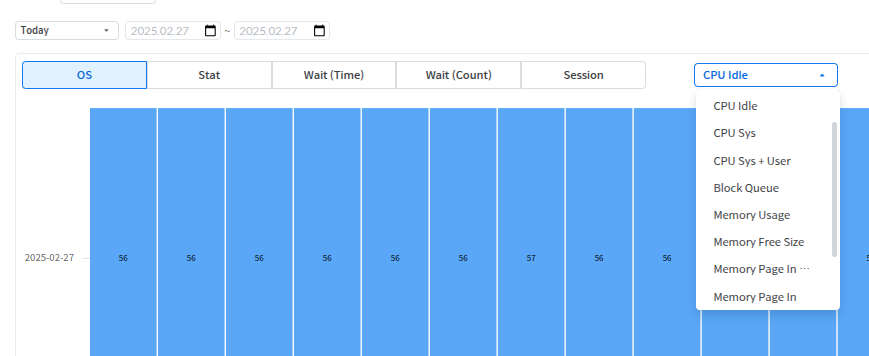
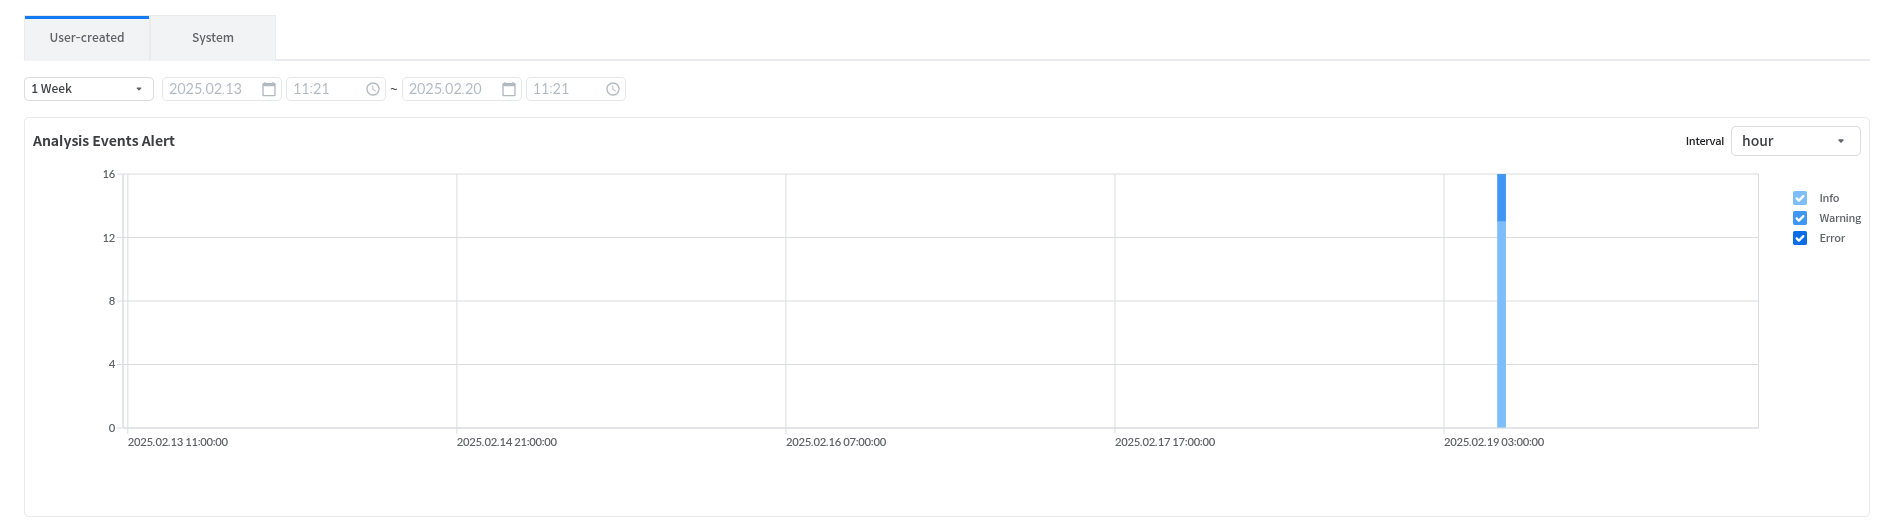
SQL ID
SQL ID
Child Number
Child Number value of SQL ID
SQL Text
Executed SQL text
Elapsed Time
Executed SQL Elapsed Time
Machine
Host name of connected session
Module
Module name set as dbms_application_info.set_module
Program
Program name of session
User Name
Current user name
OS User
OS account name of connected session
CPU Time
CPU usage time
Logical Reads
Logical Reads value
Physical Reads
Physical Reads value
Execute Counts
Execute Count value
Redo Entries
Redo Entries value
Hard Parse
Hard Parse value
Cluster Wait
The time waited for Cluster Wait
IO Wait
The time waited for IO Wait
Redo Wait
The time waited for Redo Wait
Standby Wait
The time waited for Standby Wait
Redo TAC Wait
The time waited for Redo TAC Wait
Resource Wait
The time waited for Resource Wait
SQL Wait
The time waited for SQL Wait
SQL TAC Wait
The time waited for SQL TAC Wait
Recovery Wait
The time waited for Recovery Wait
Recovery TAC Wait
The time waited for Recovery TAC Wait
DDL Wait
The time waited for DDL Wait
PSM Wait
The time waited for PSM Wait
Internal Wait
The time waited for Internal Wait
DD Wait
The time waited for DD Wait
XA Wait
The time waited for XA Wait
Backup Wait
The time waited for Backup Wait
Session Wait
The time waited for Session Wait
Space Wait
The time waited for Space Wait
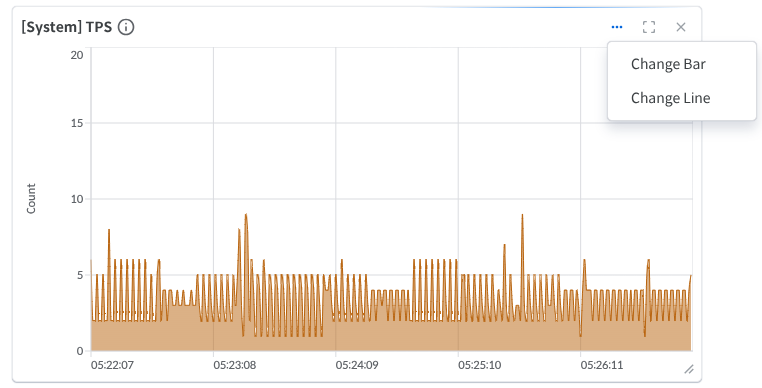
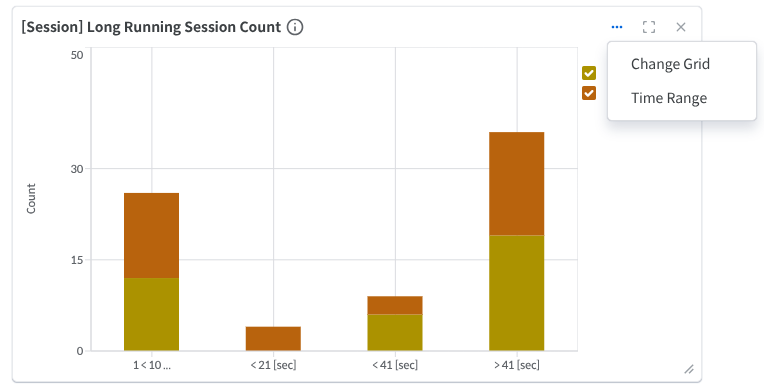
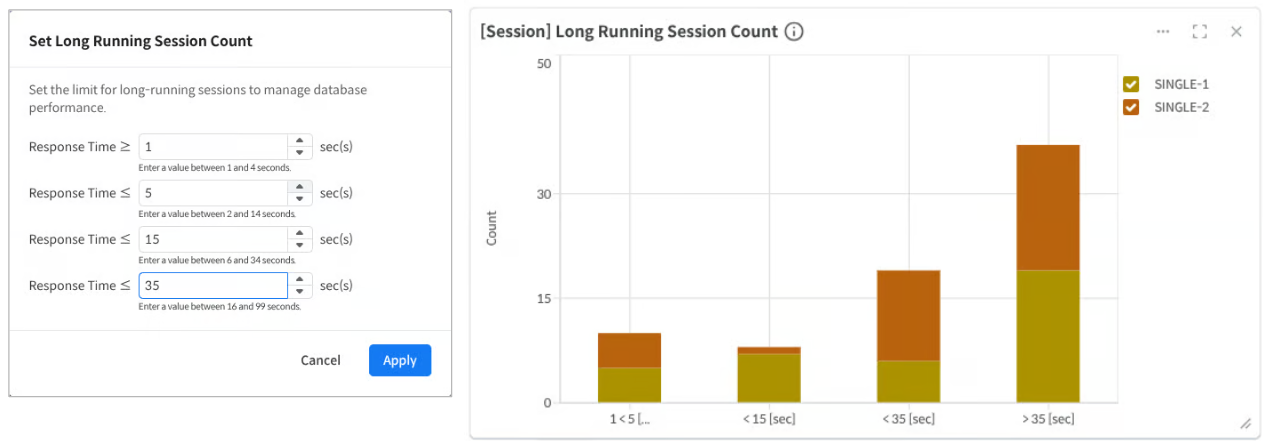
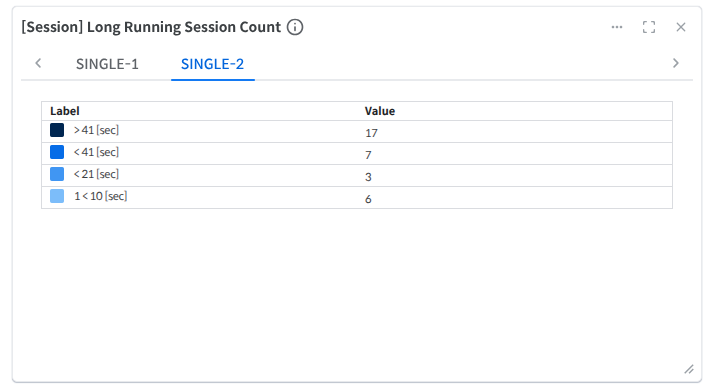
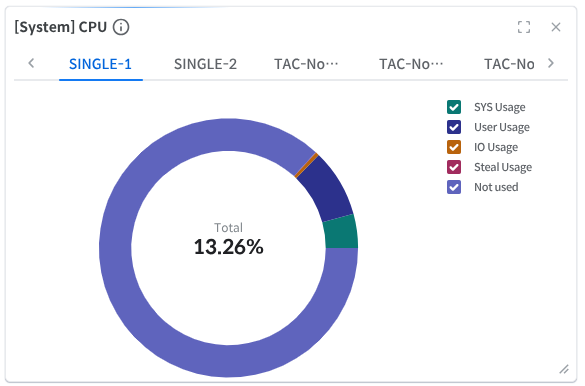
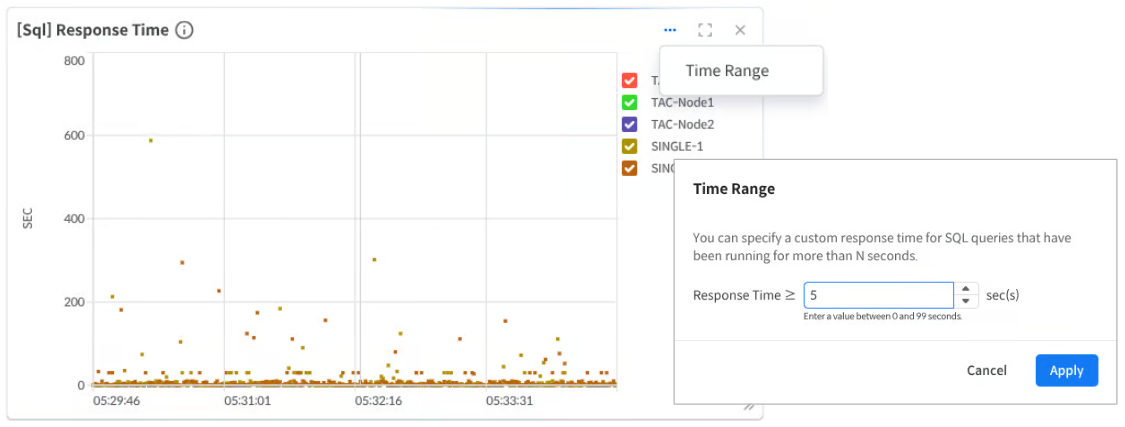
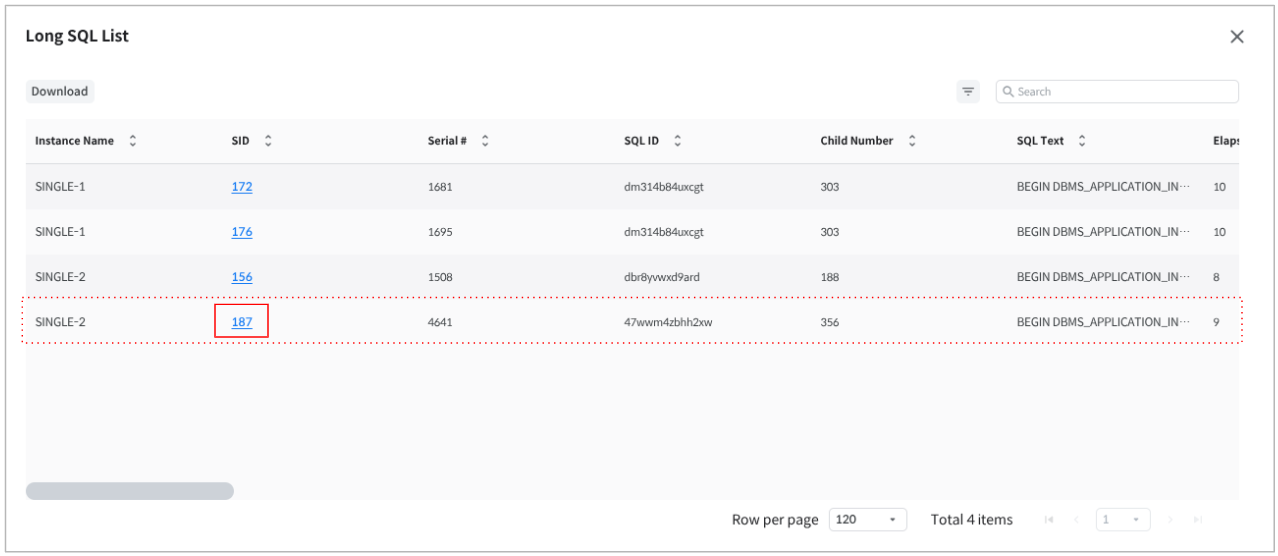
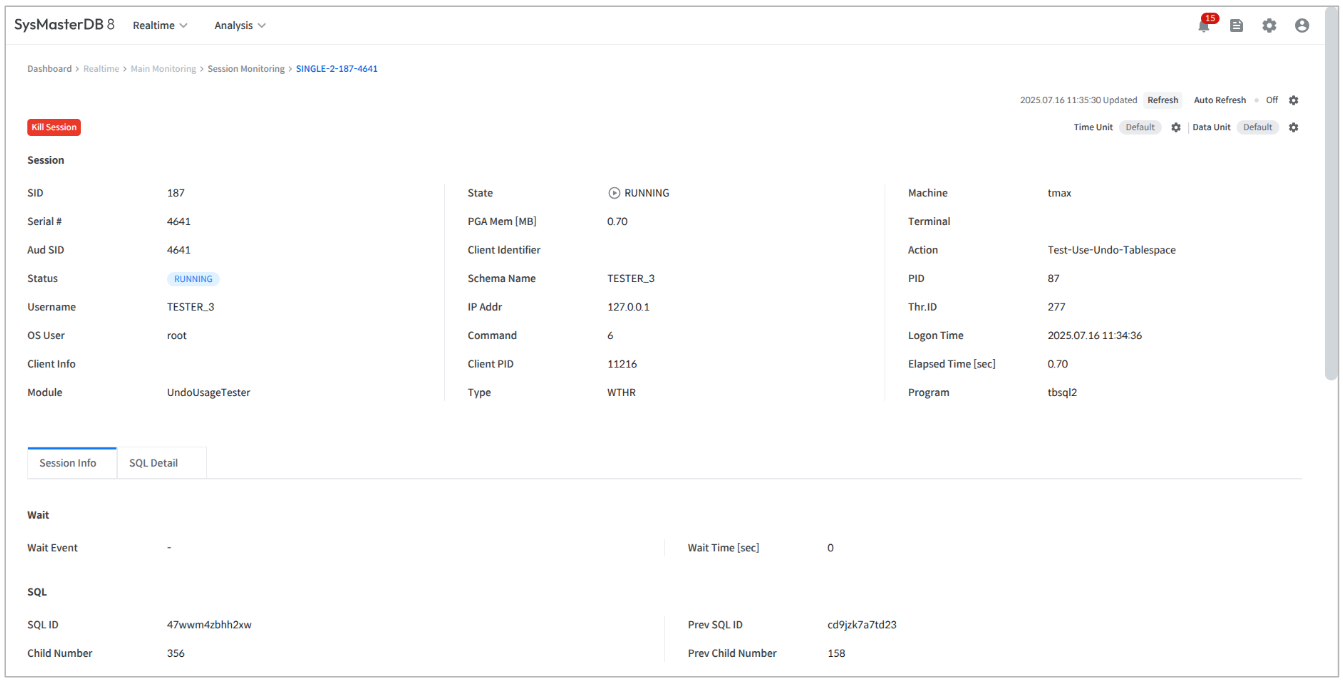
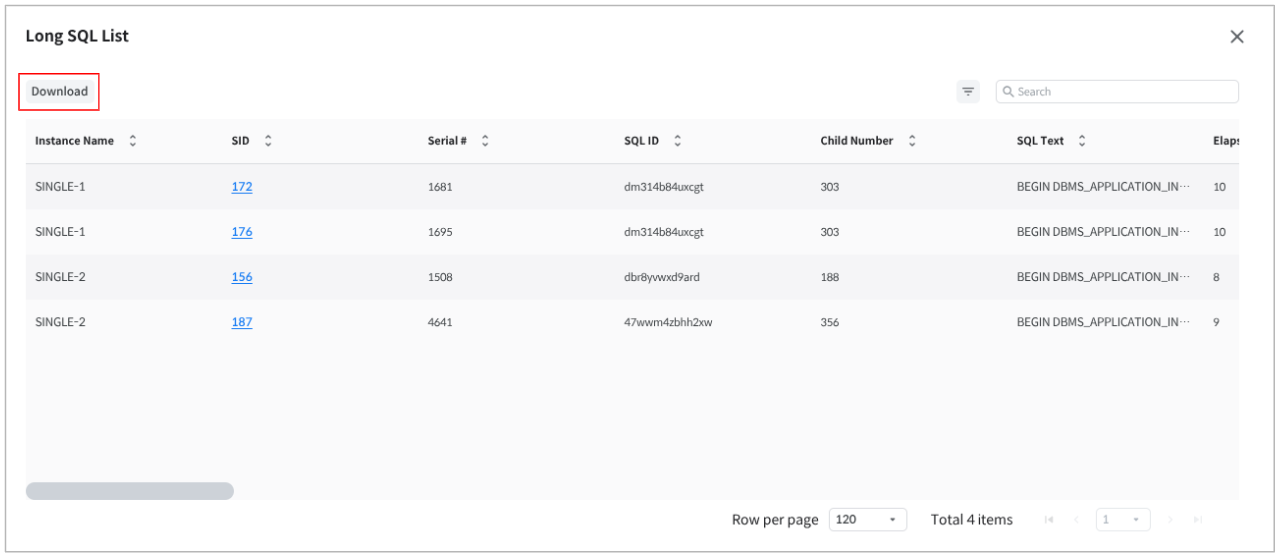
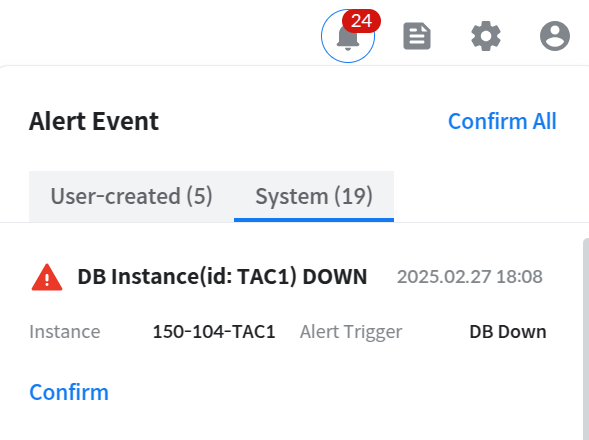

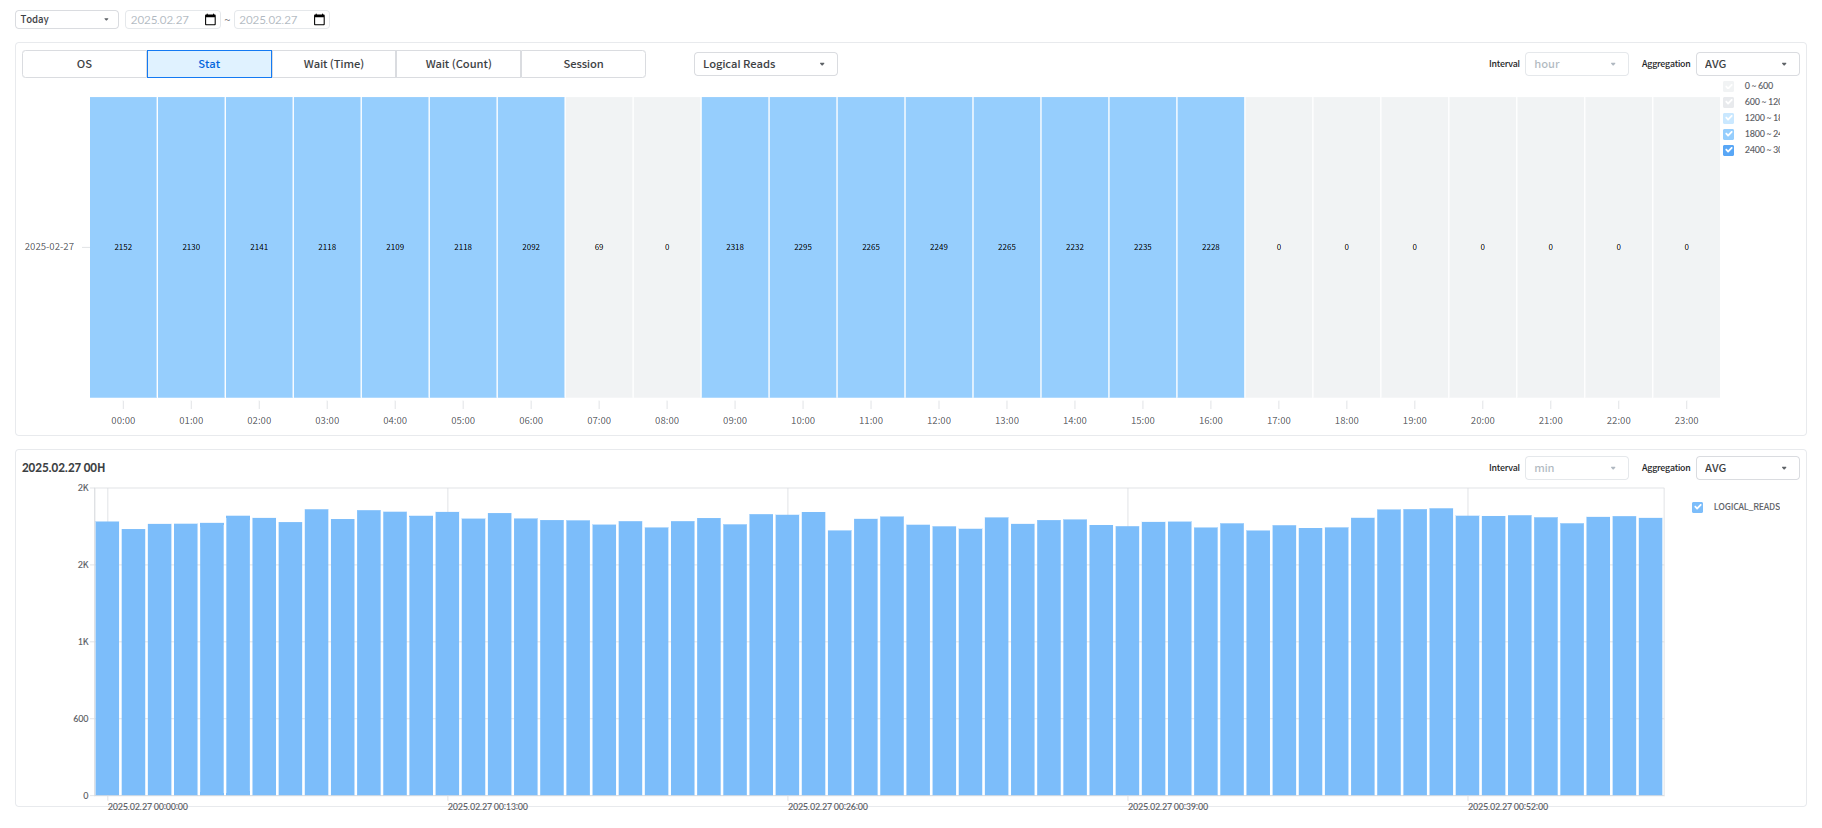
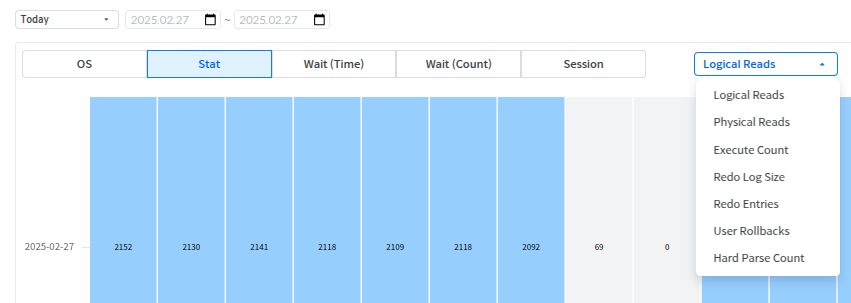
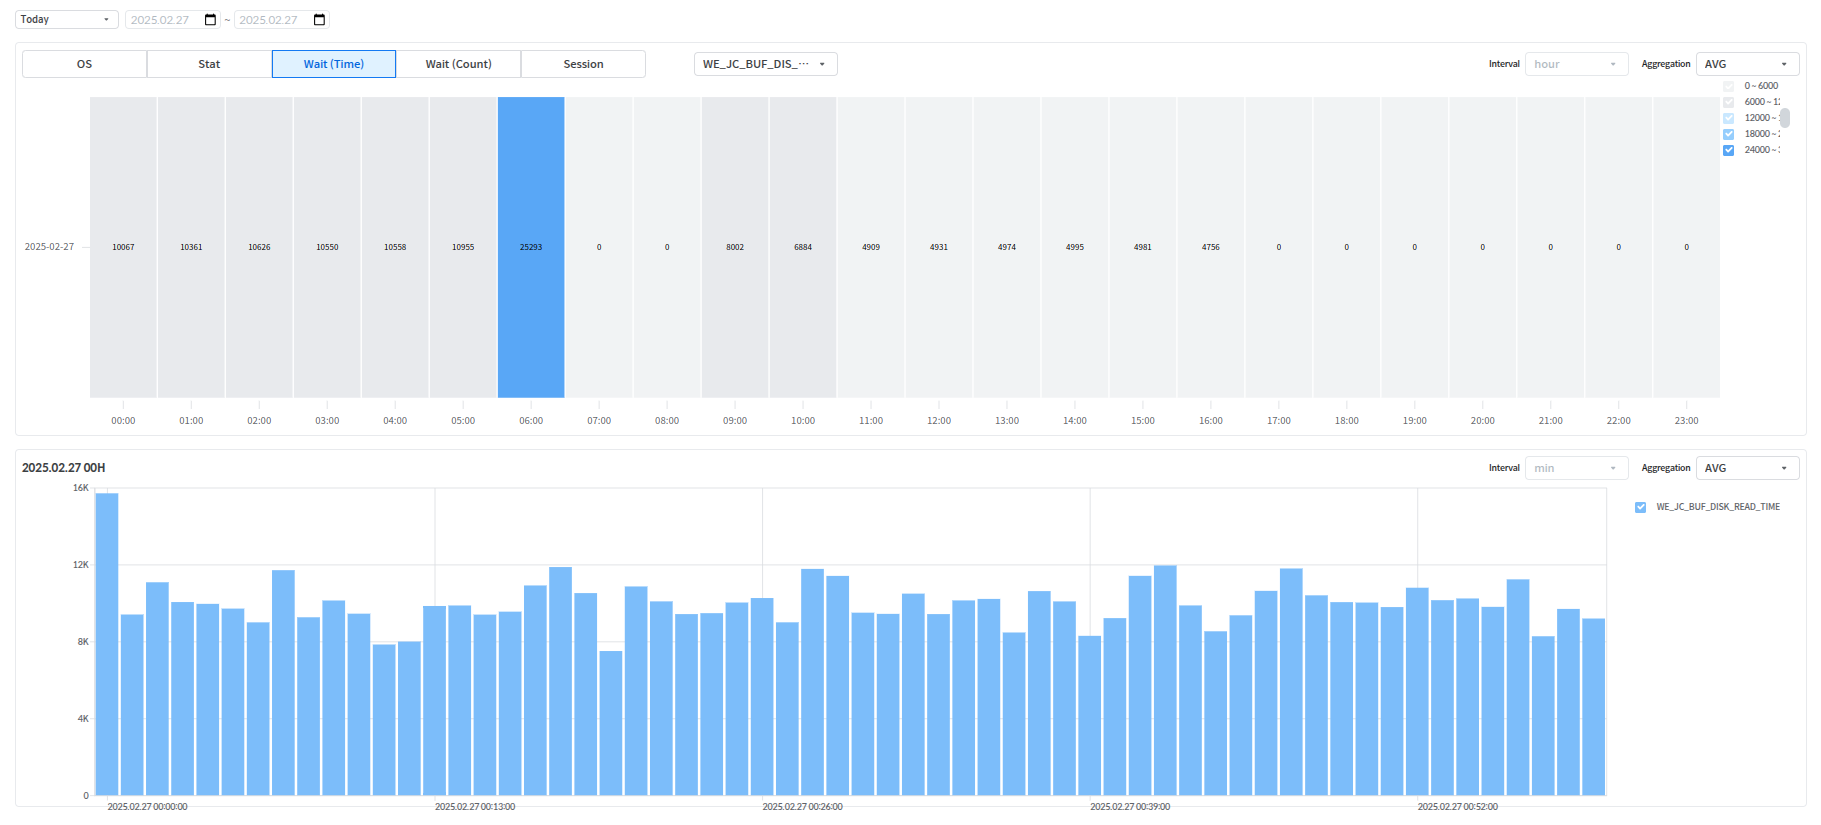
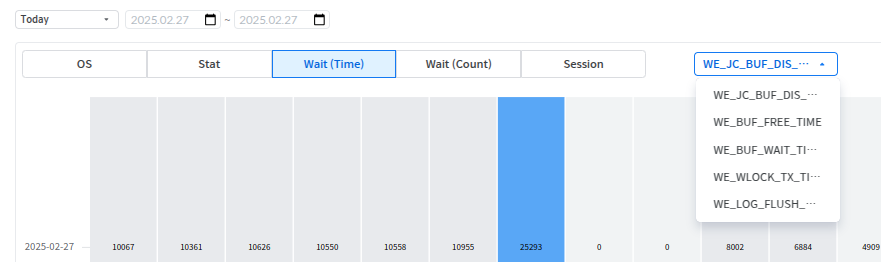
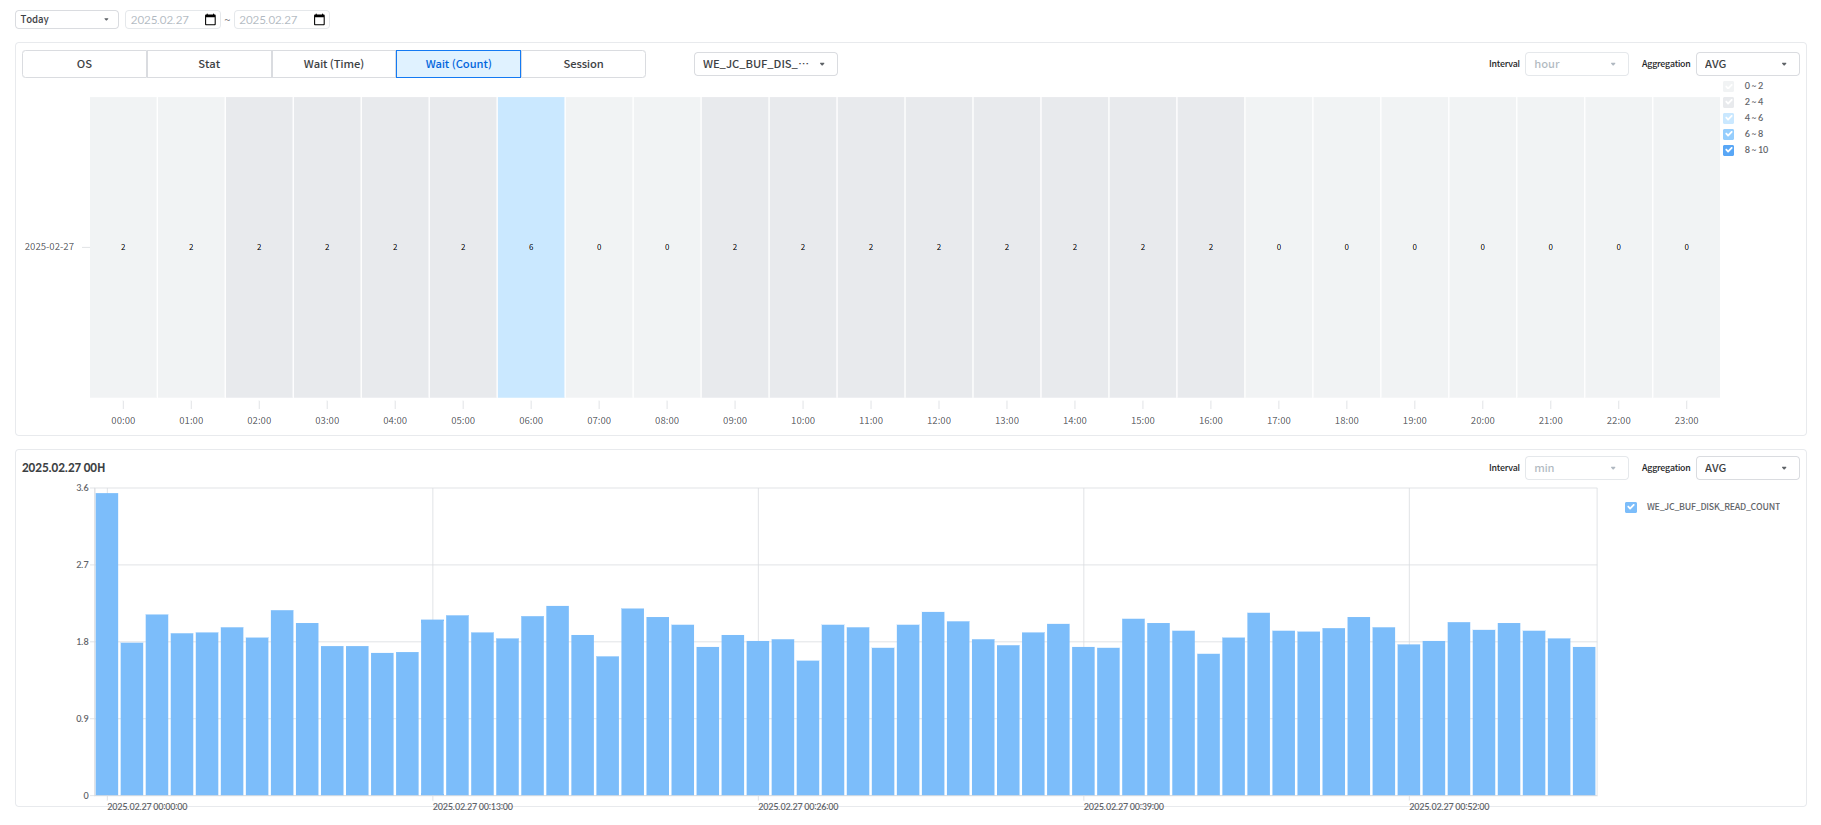
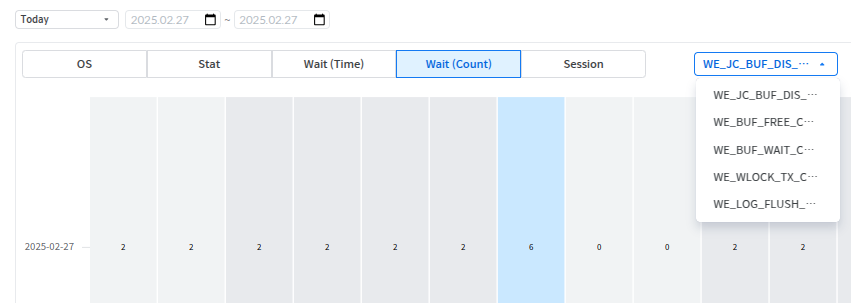
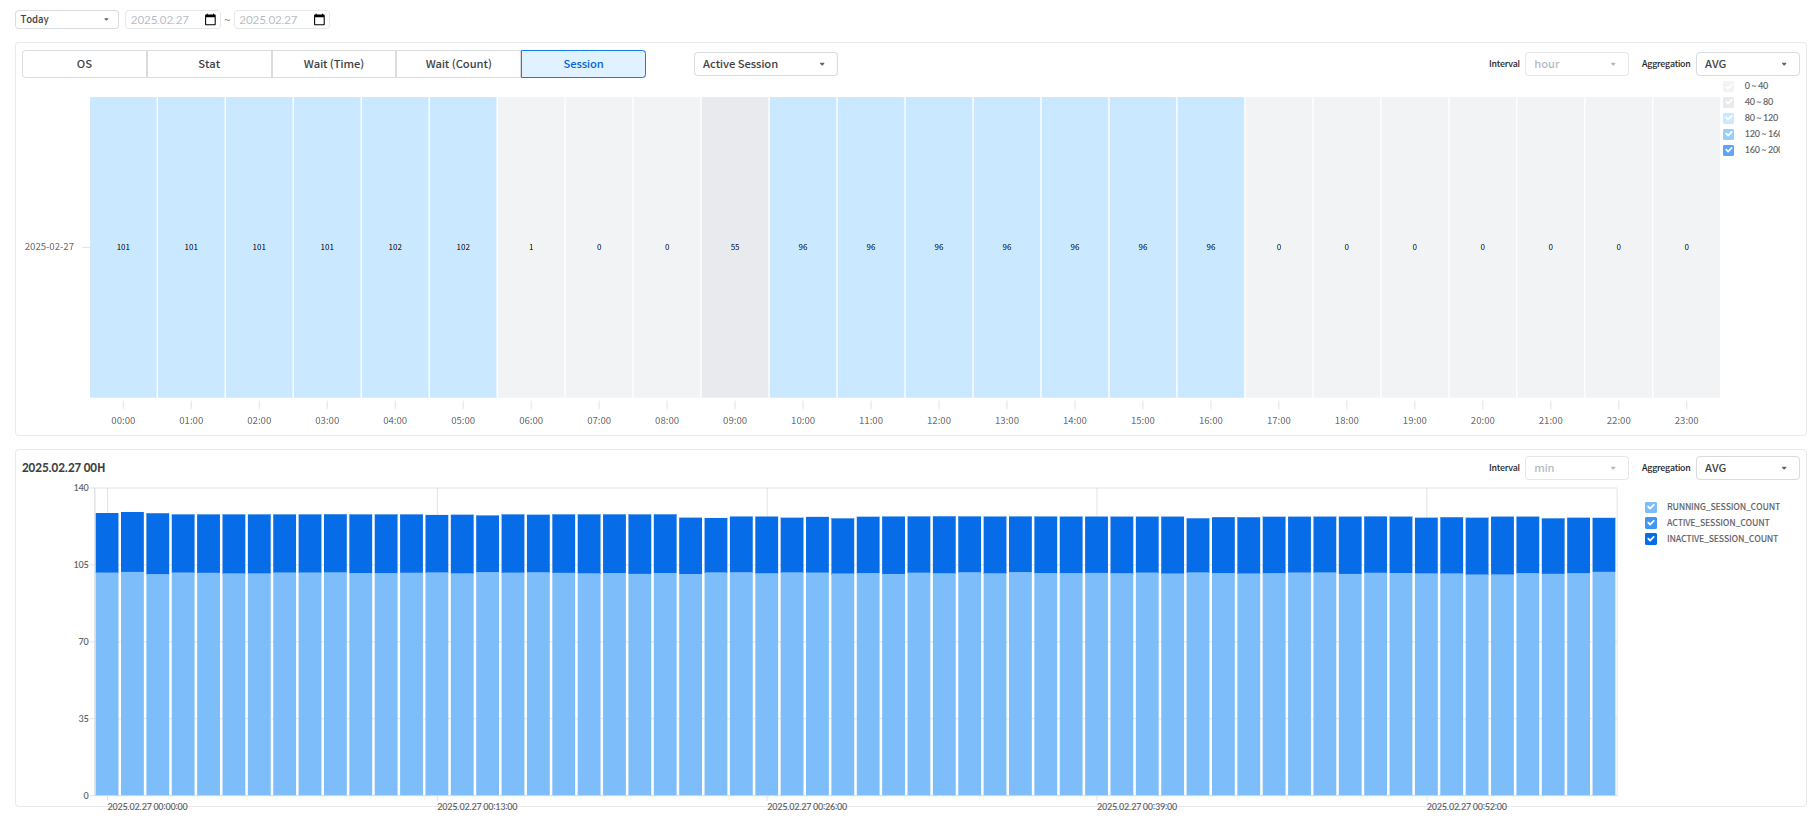
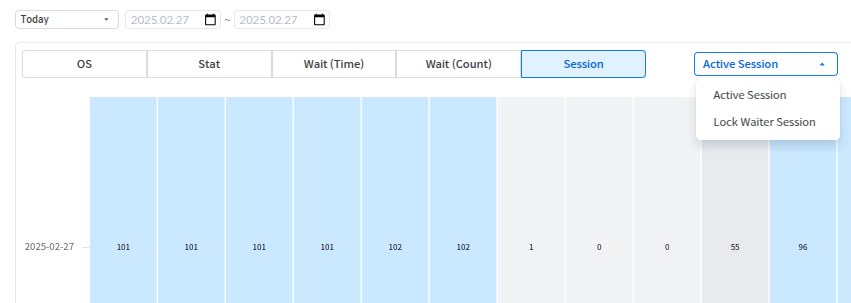
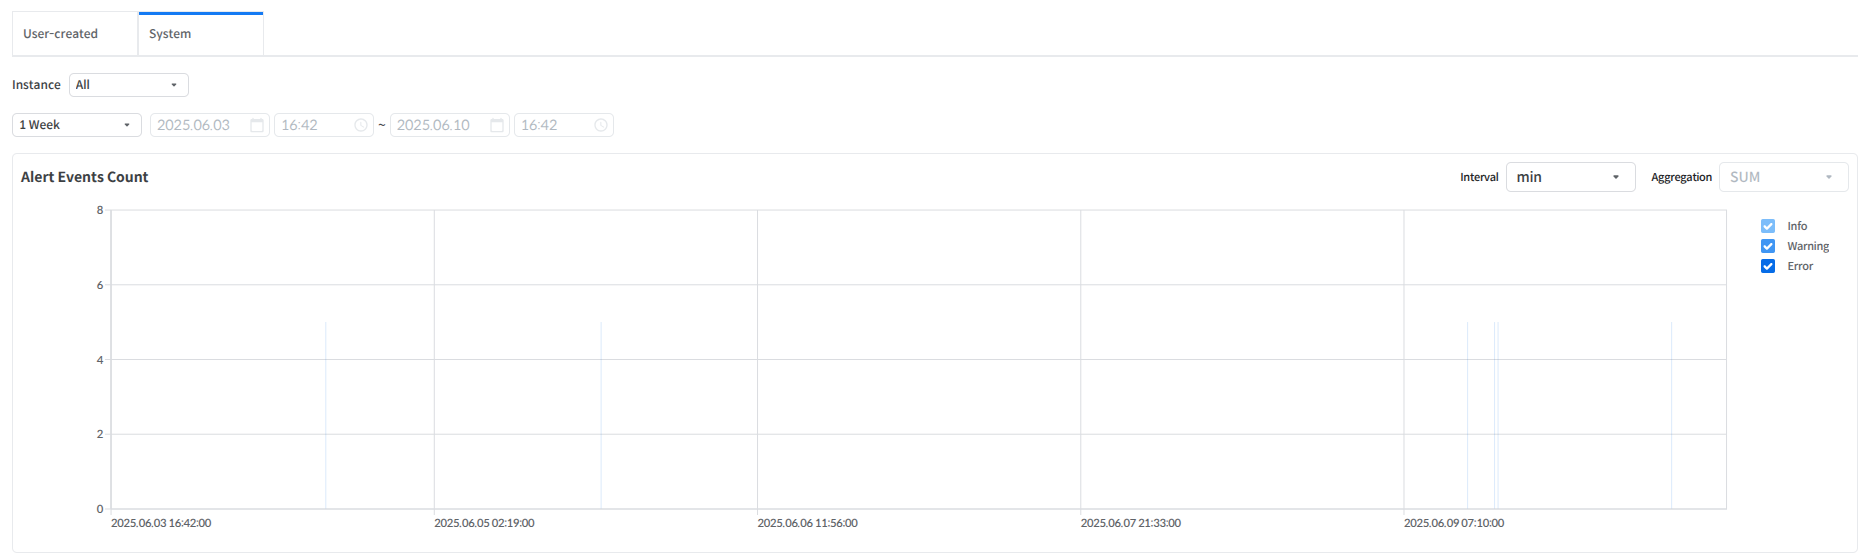


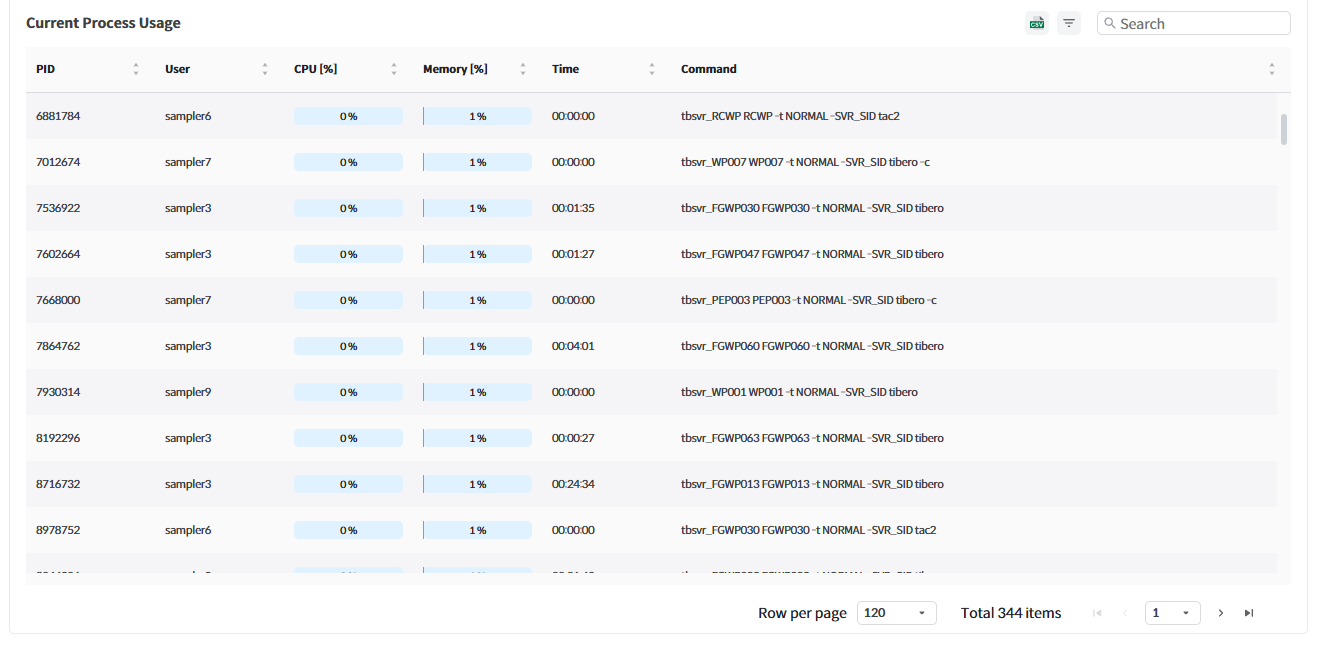
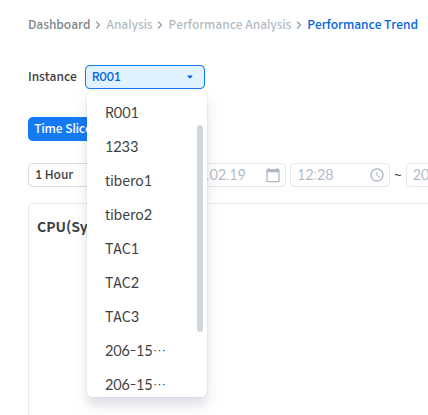

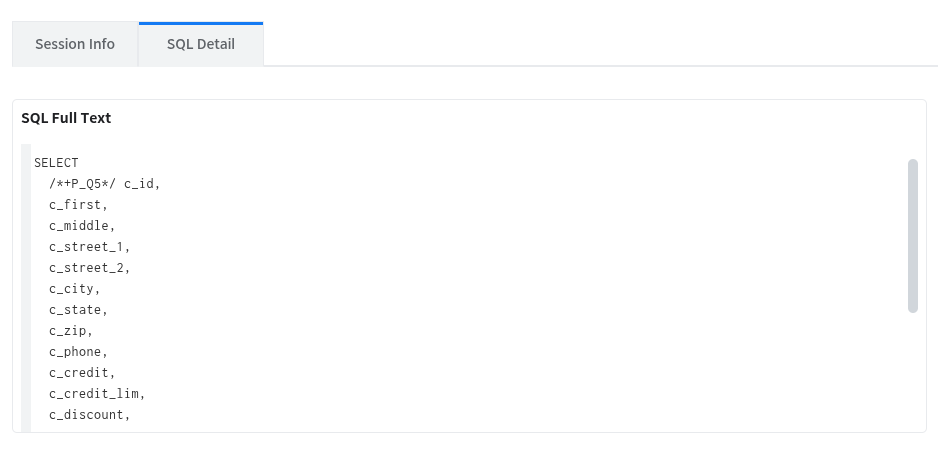
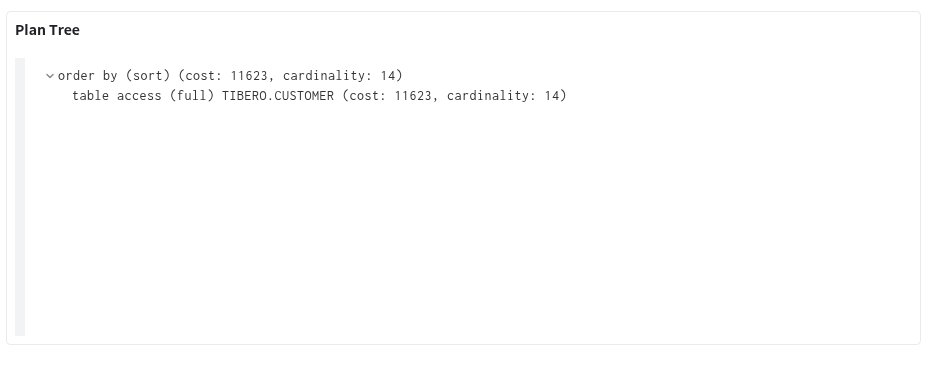
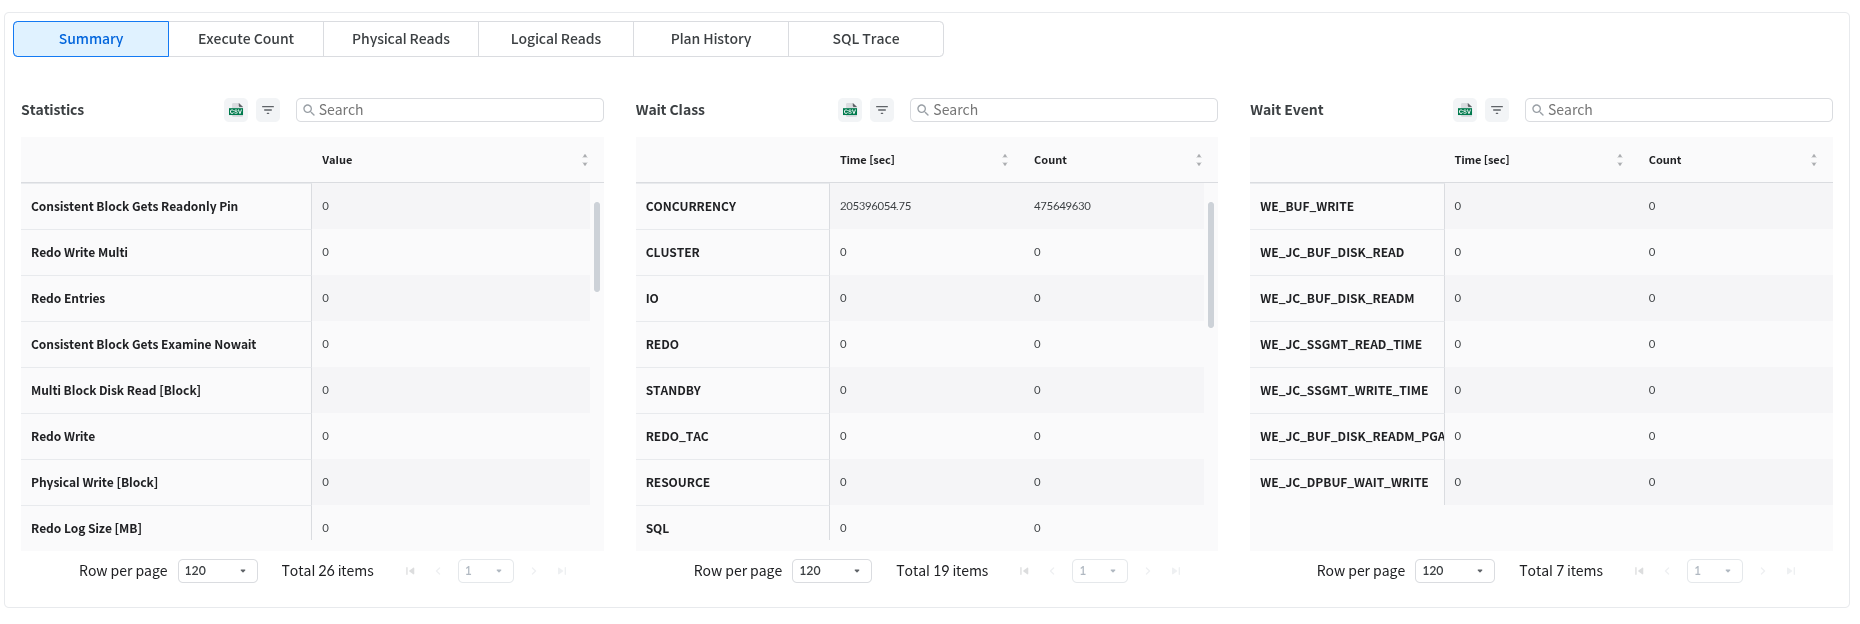
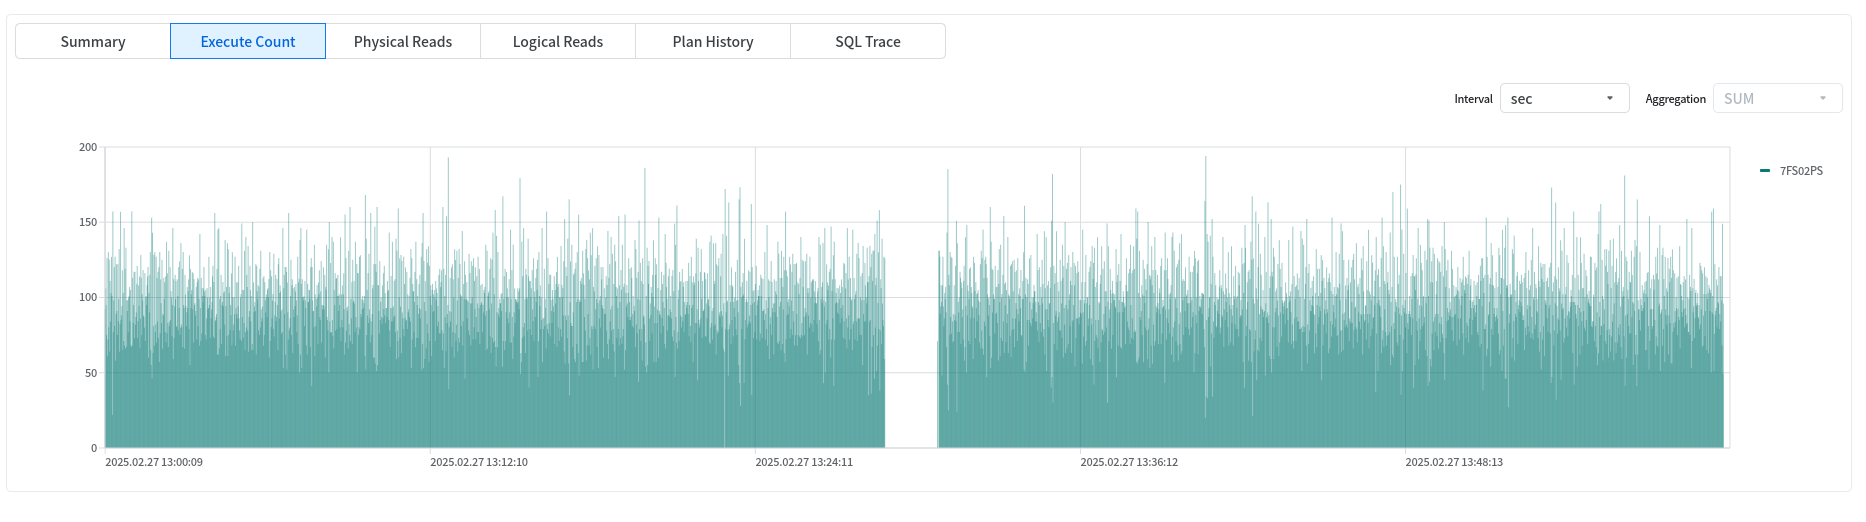
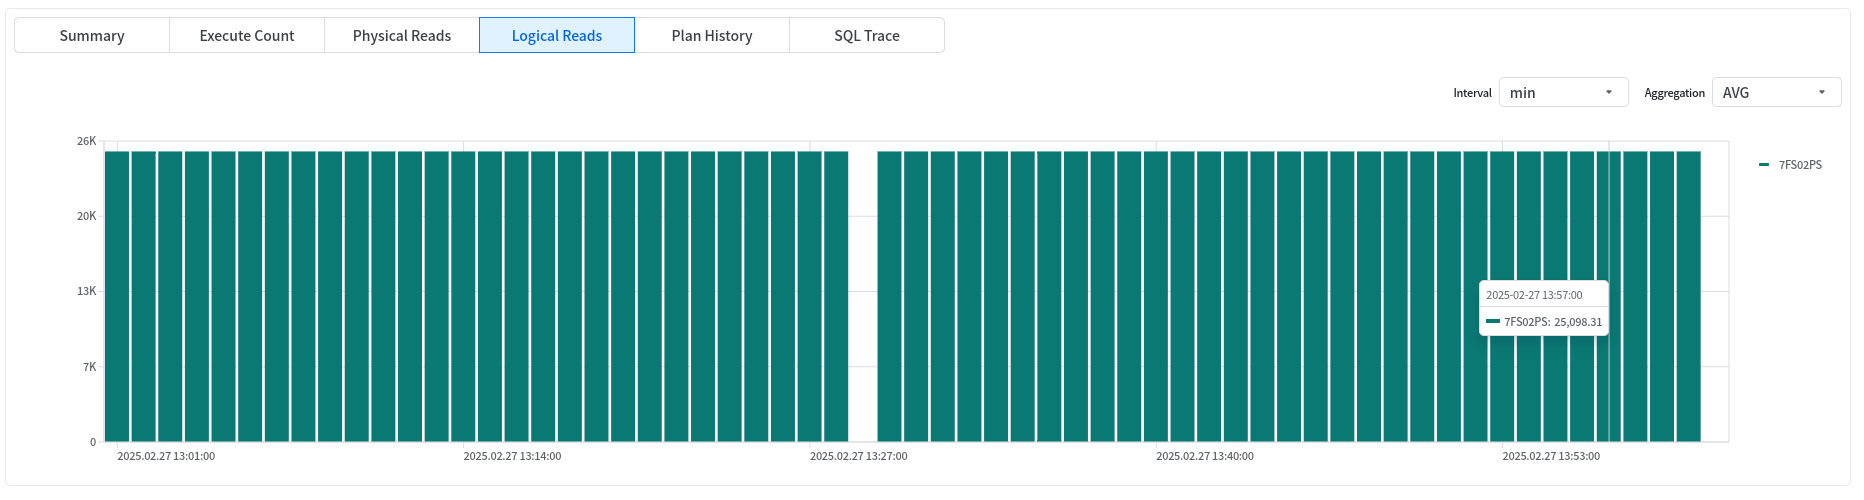
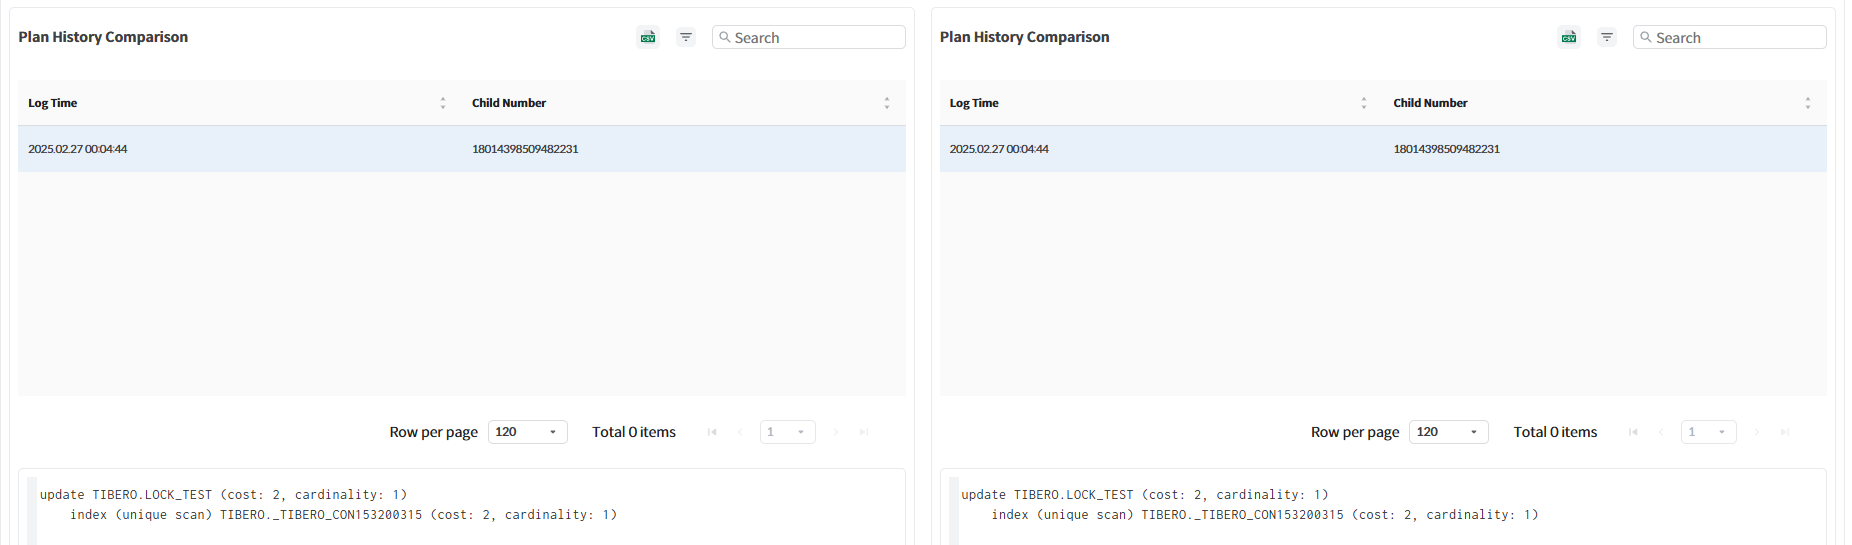
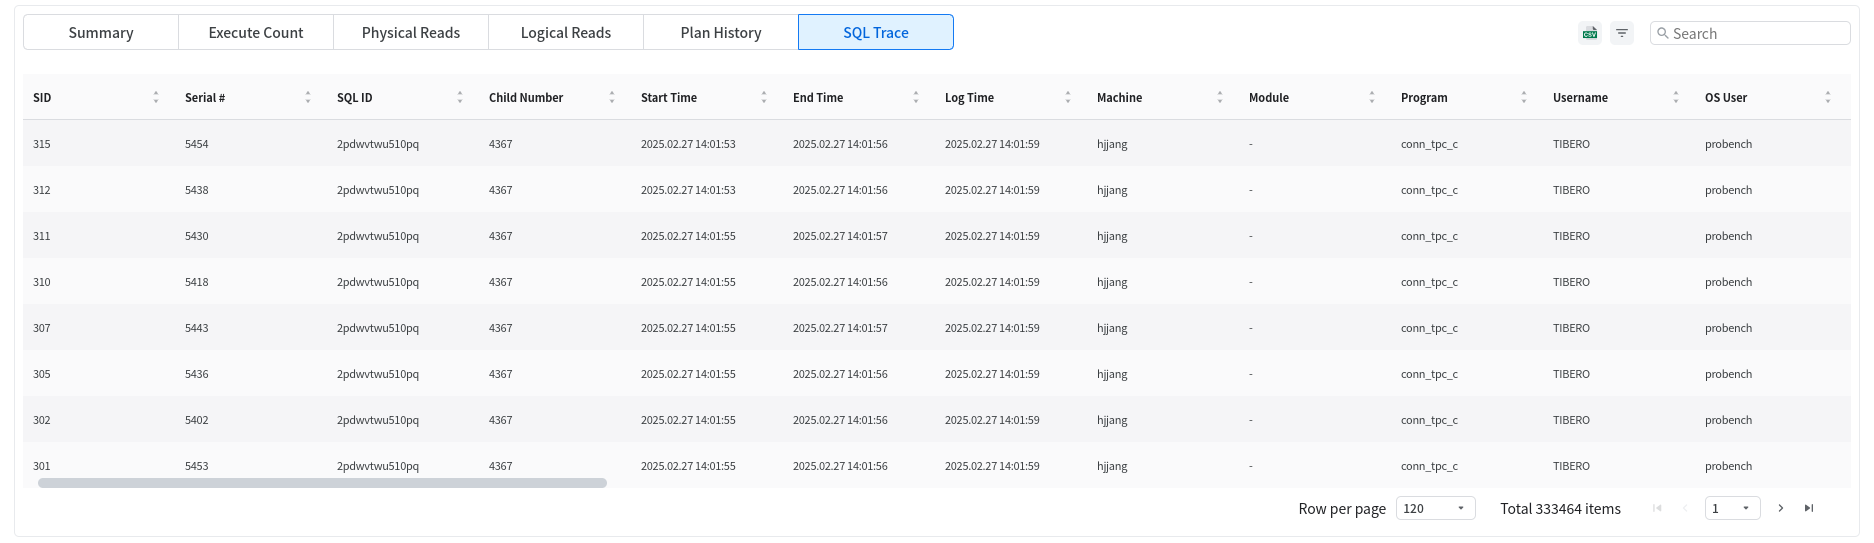
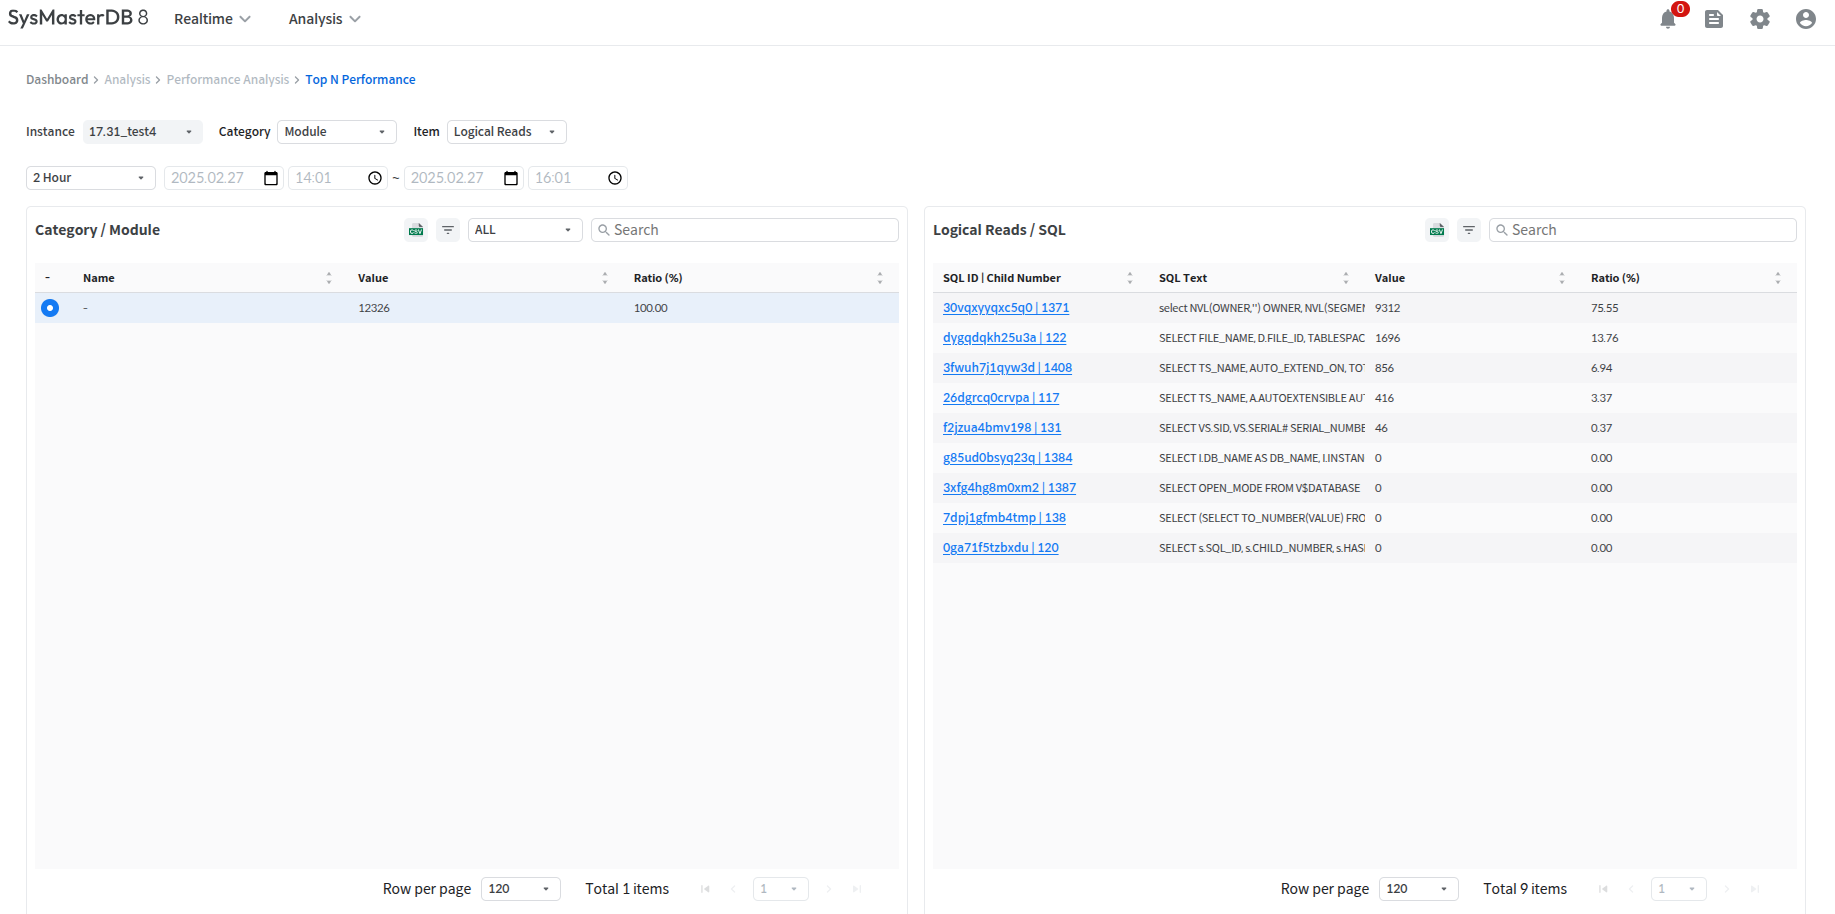
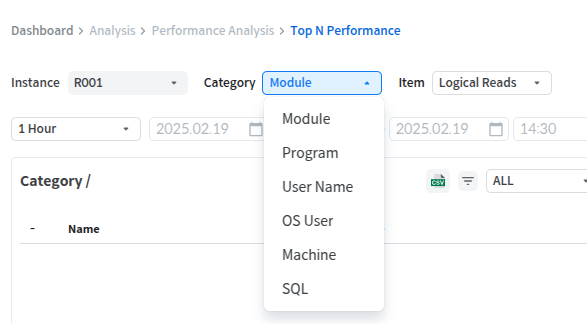
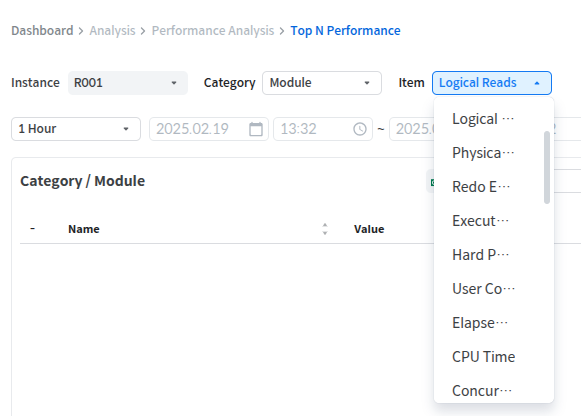
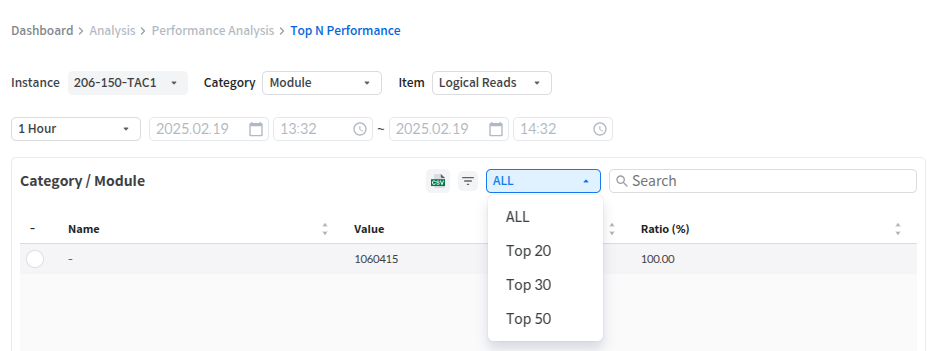
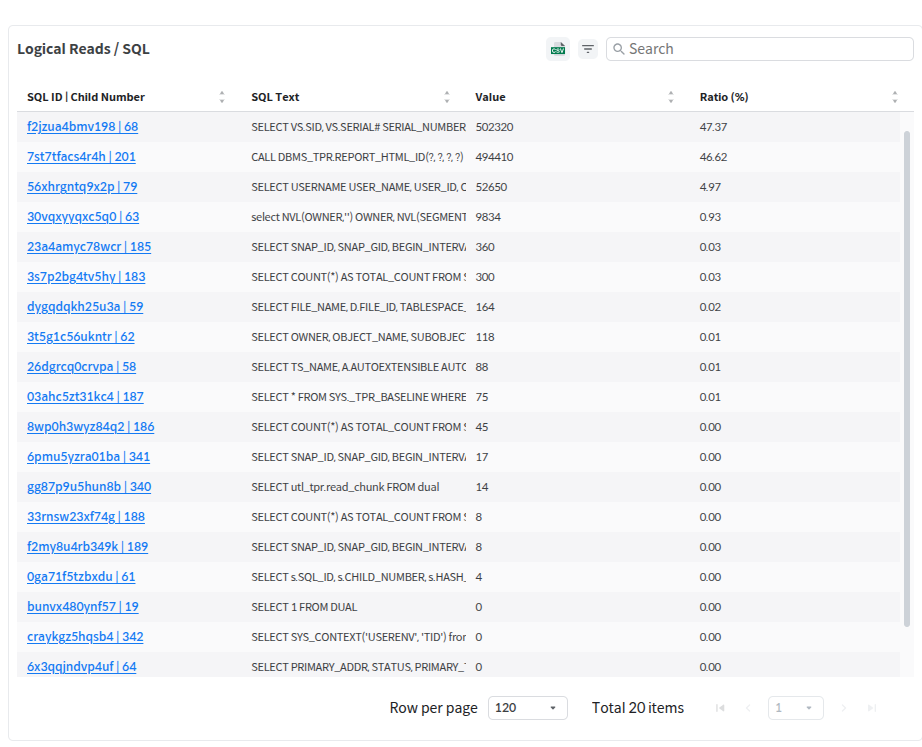
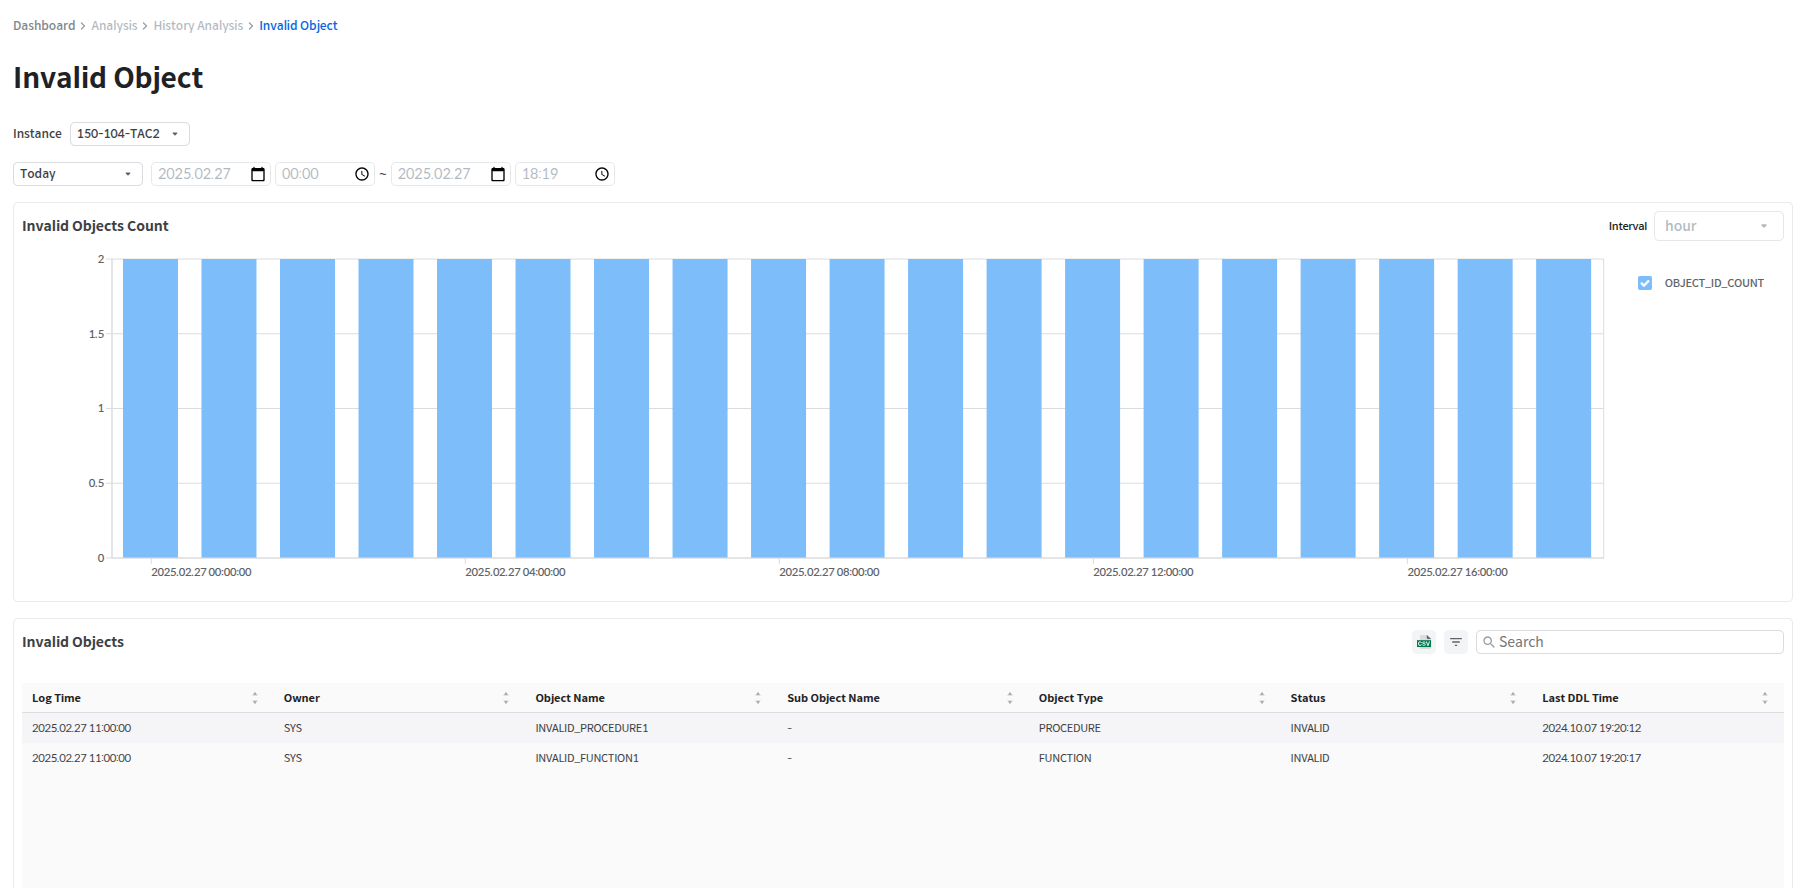
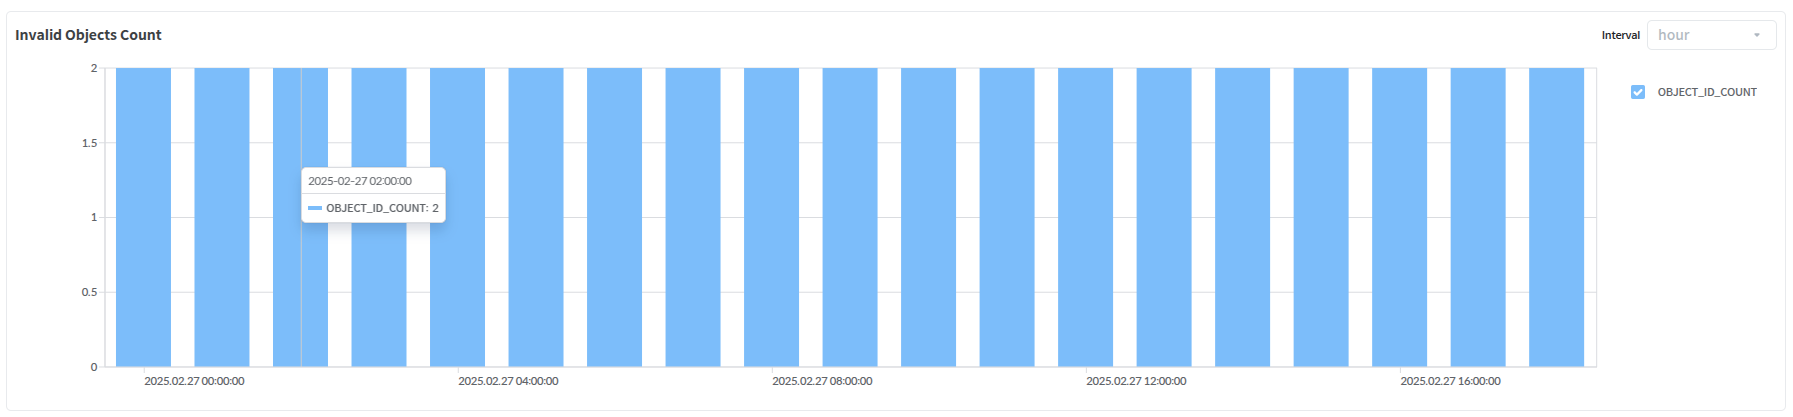
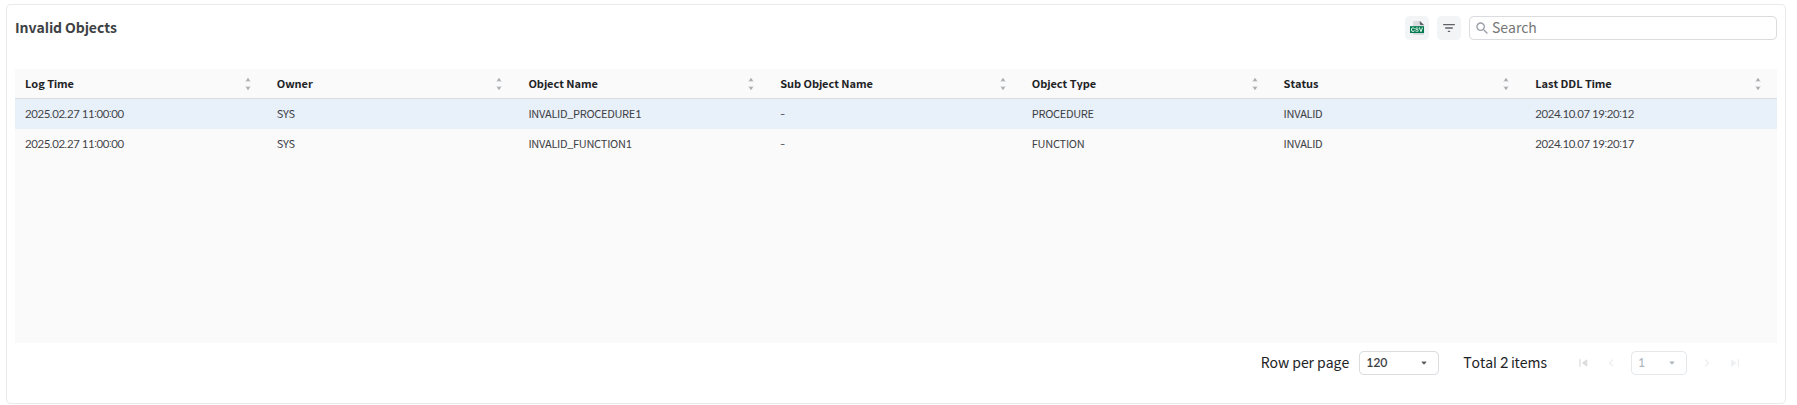
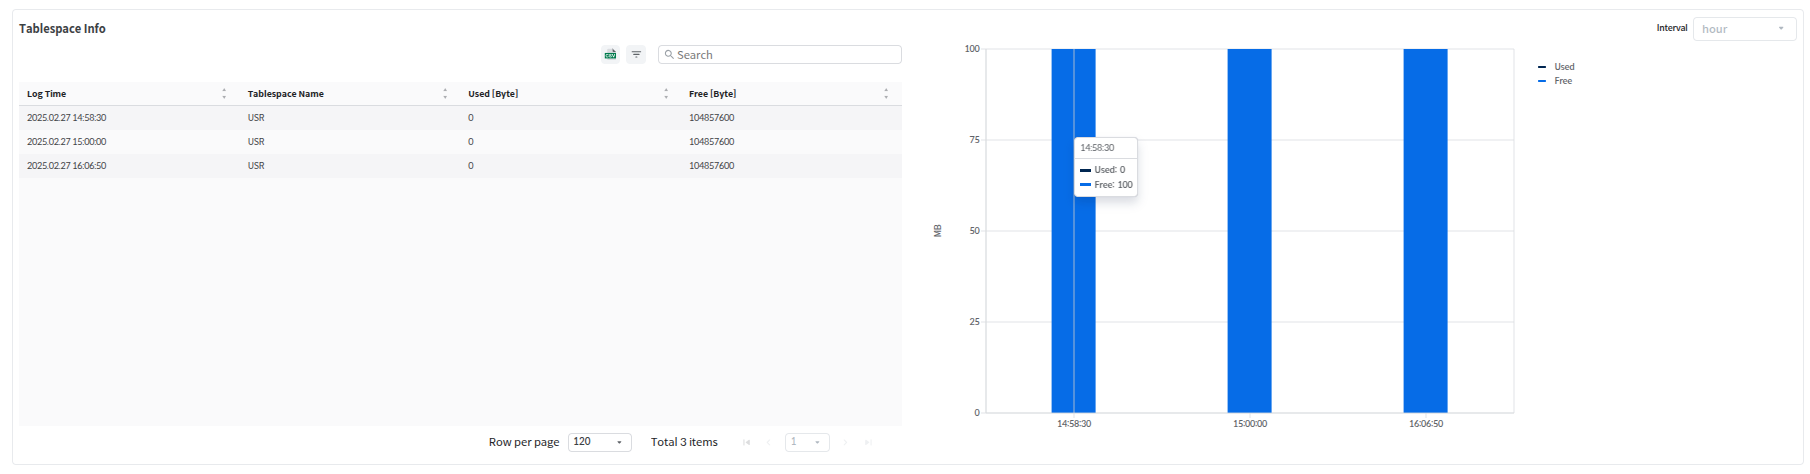
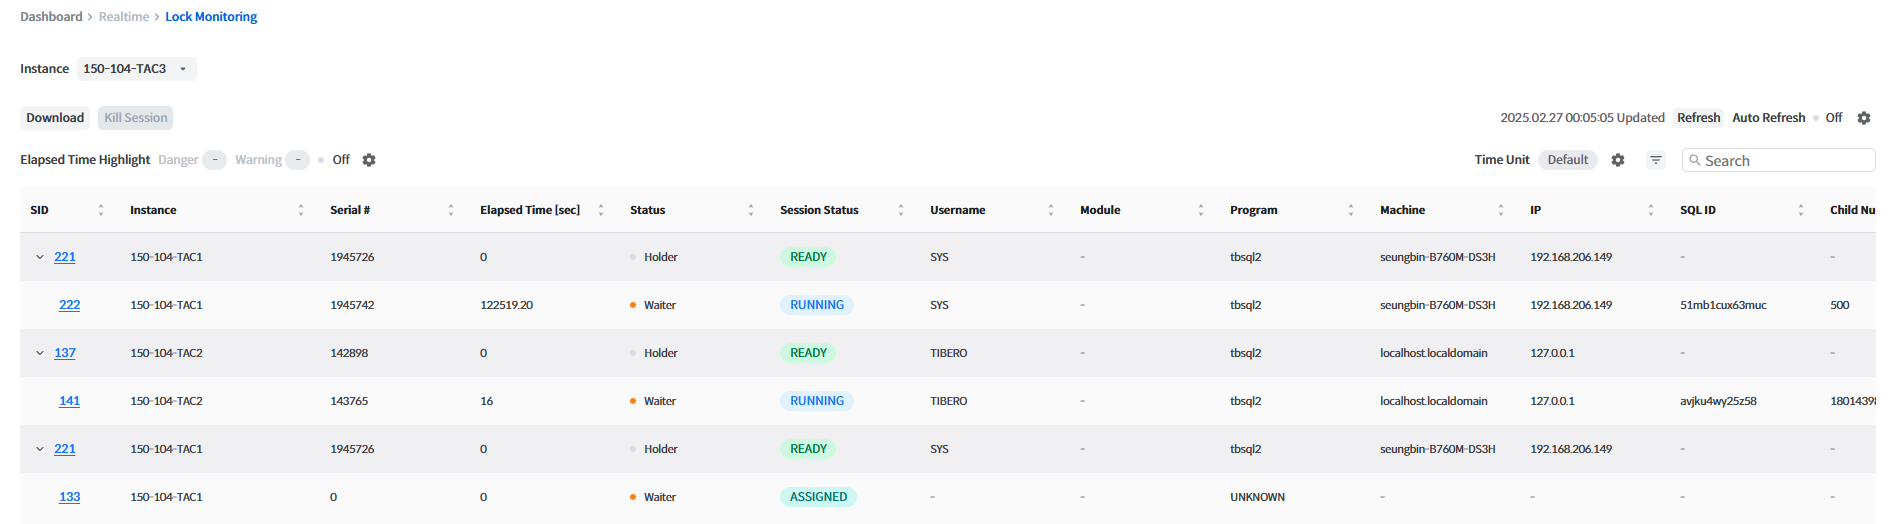
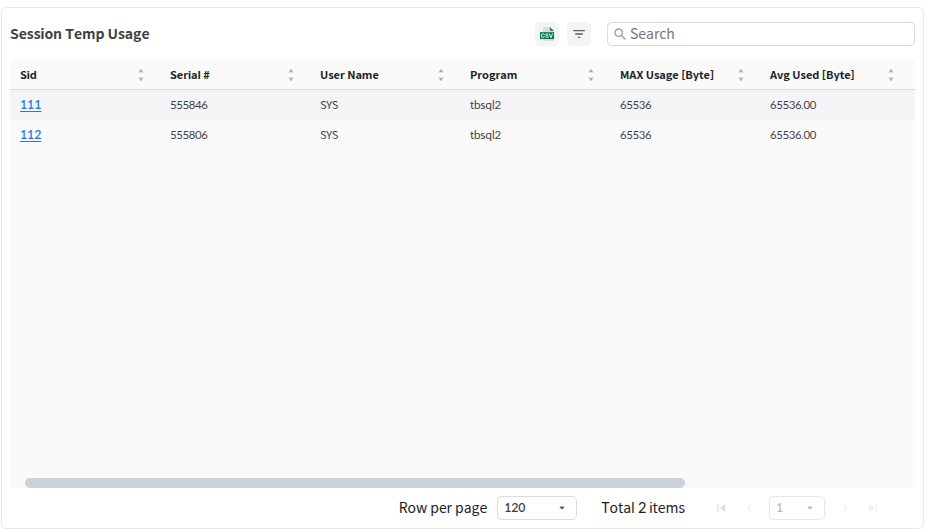
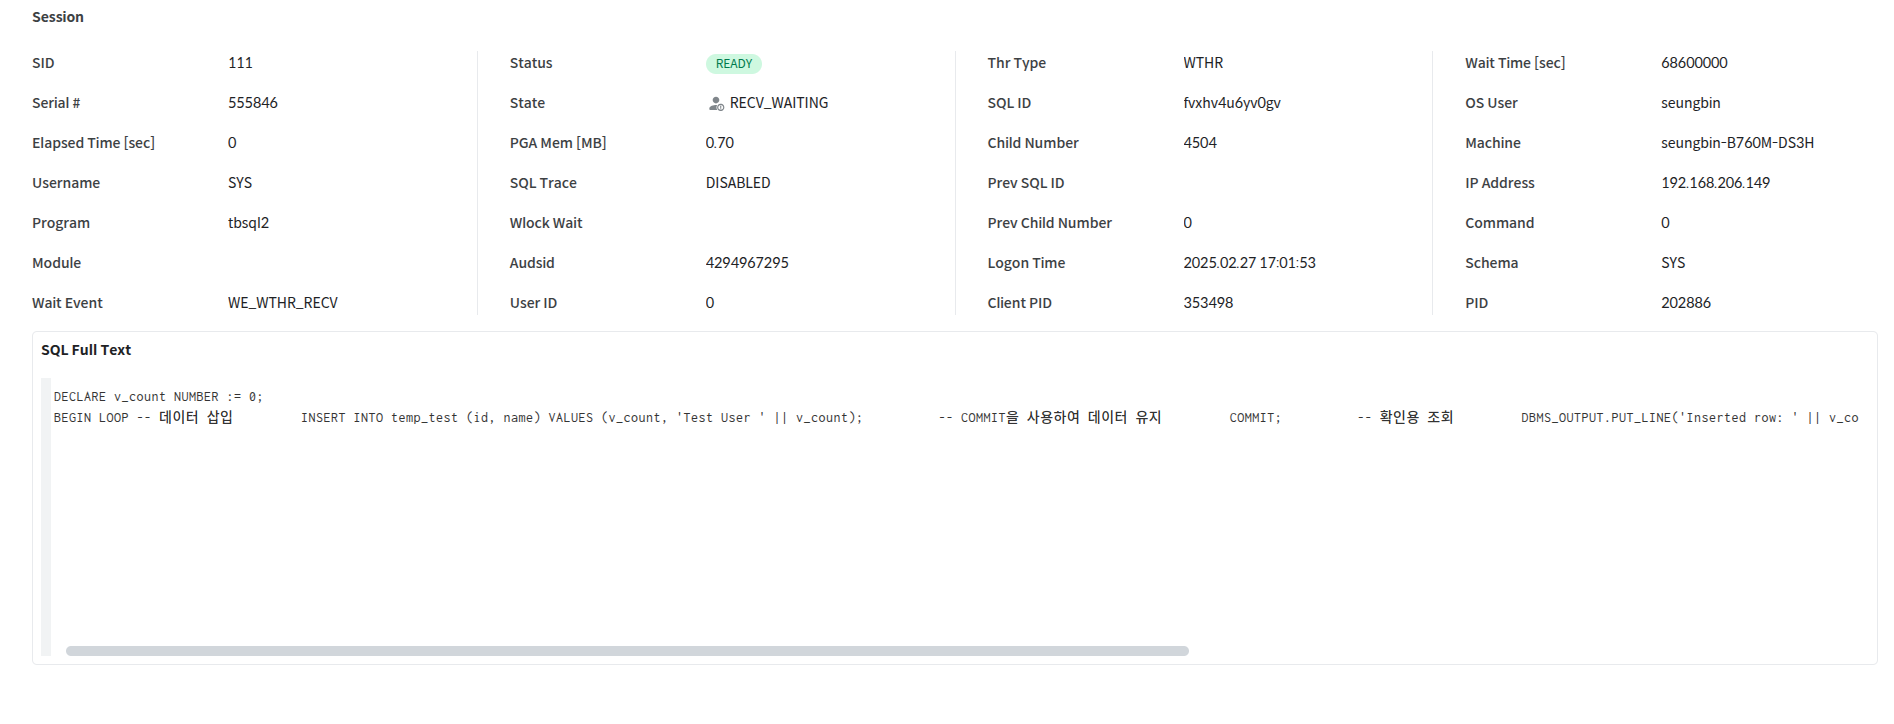
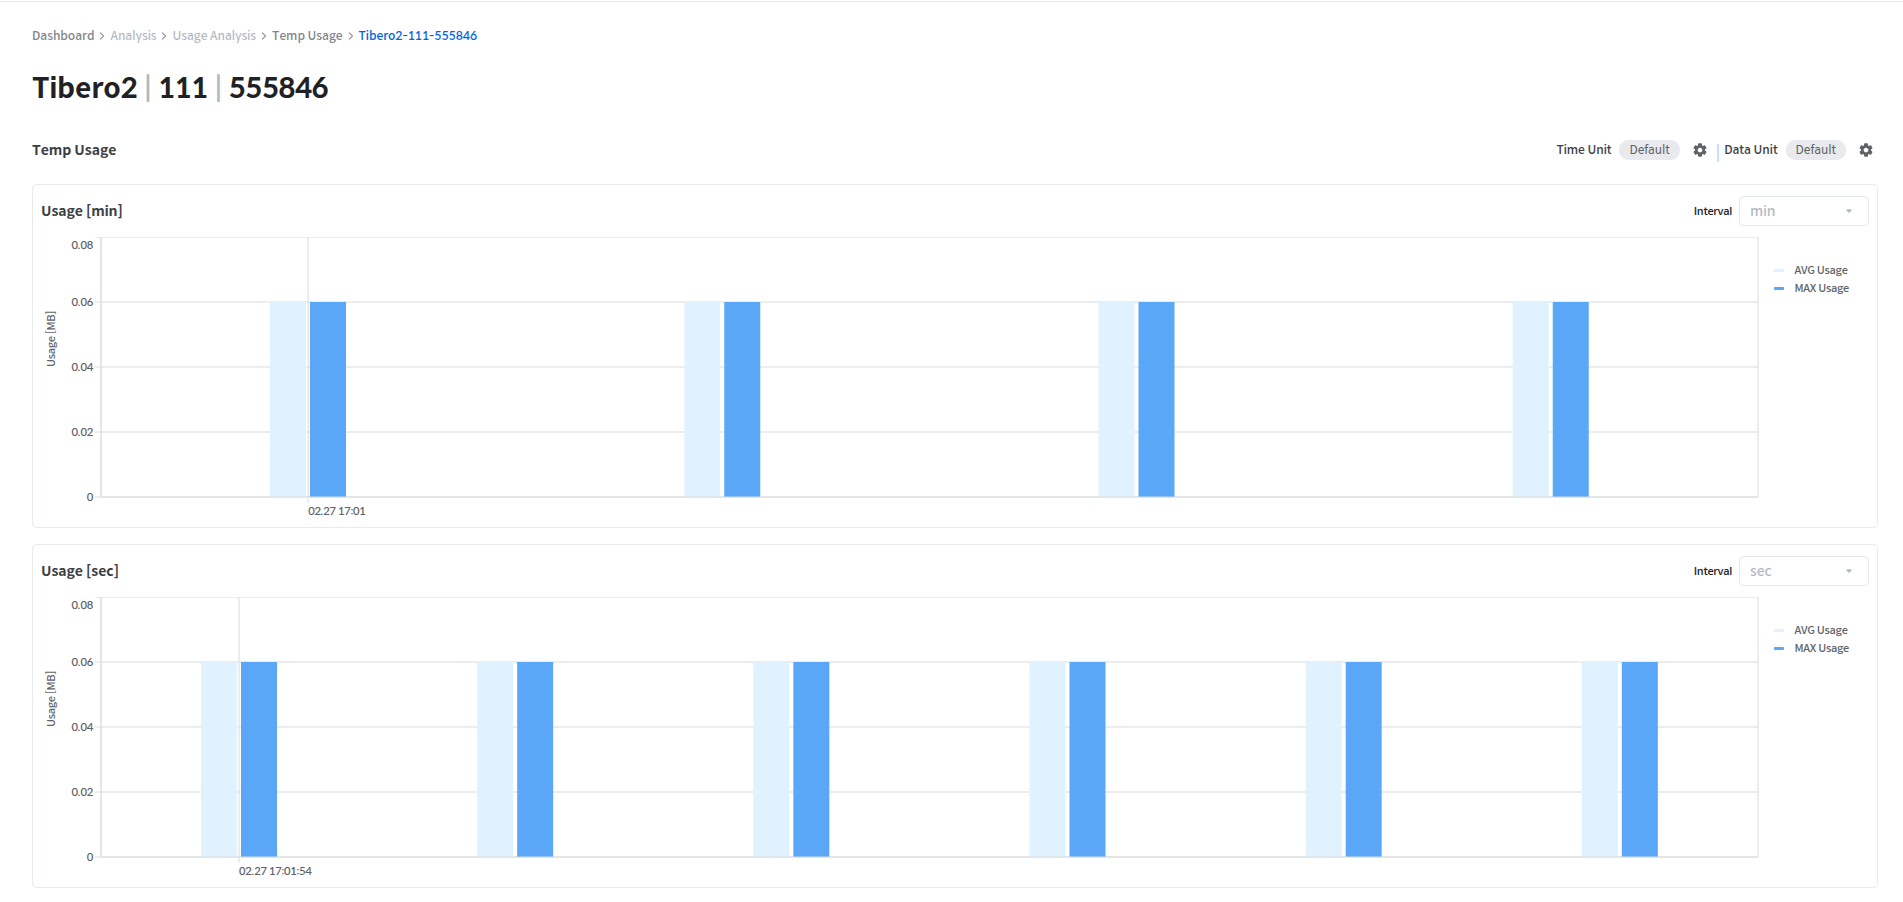
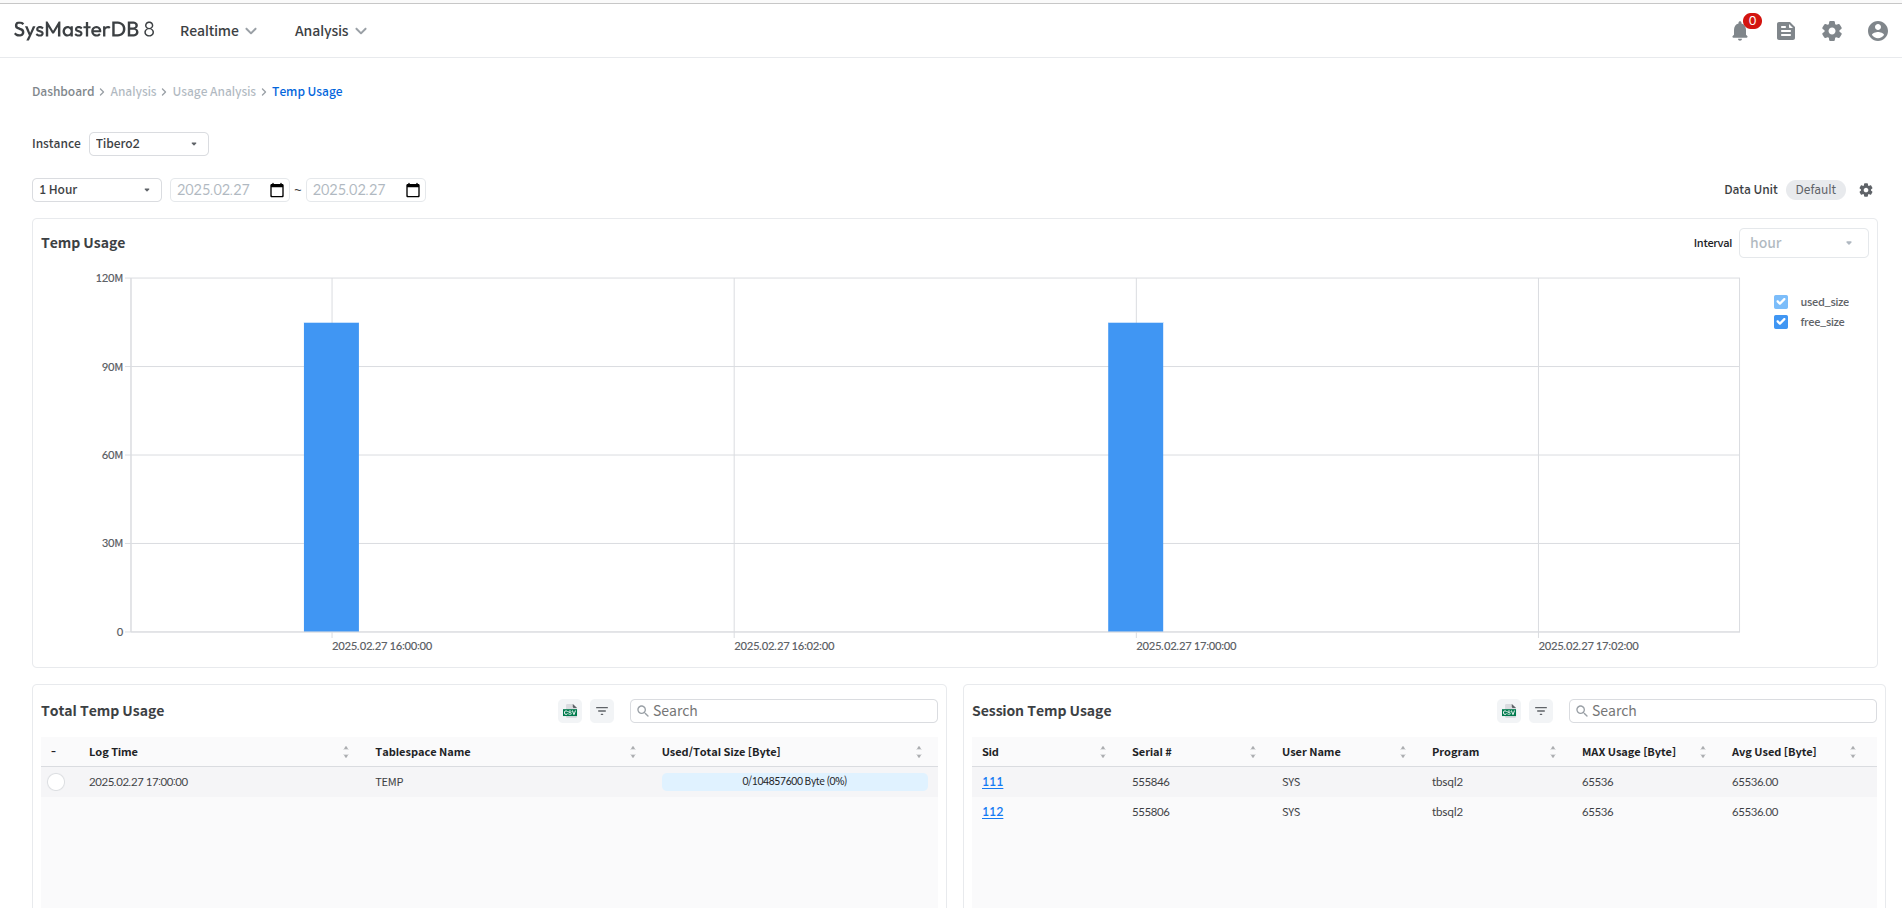
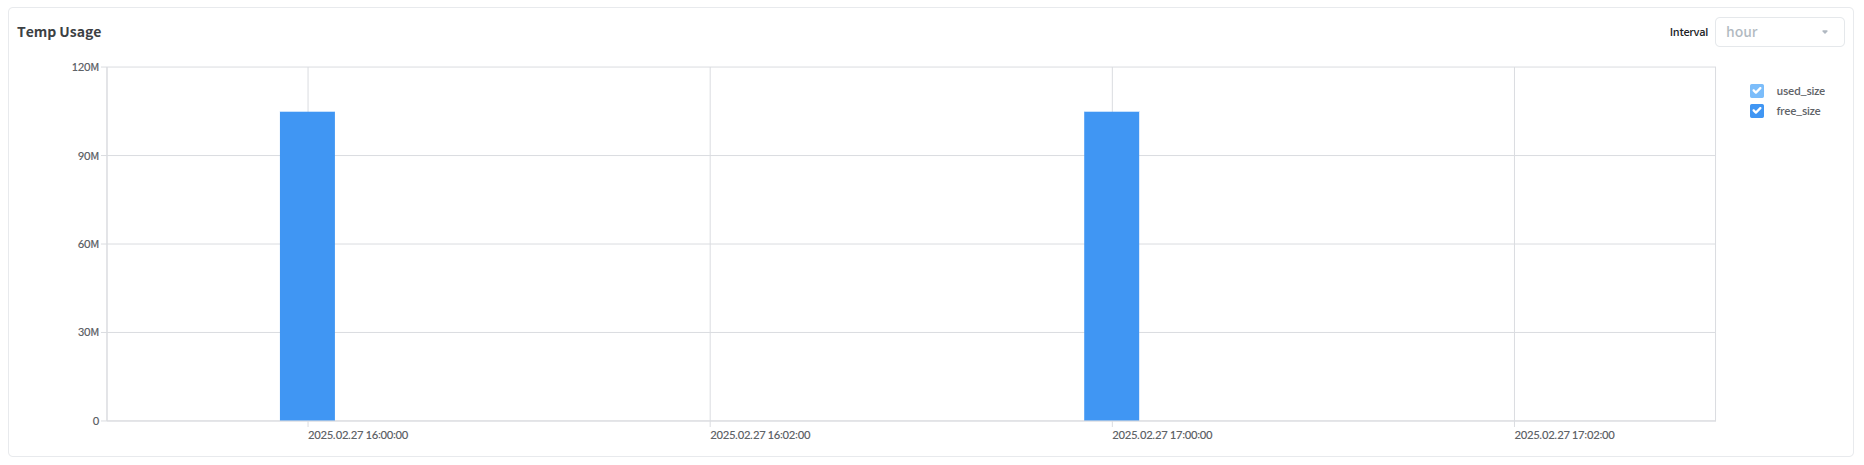
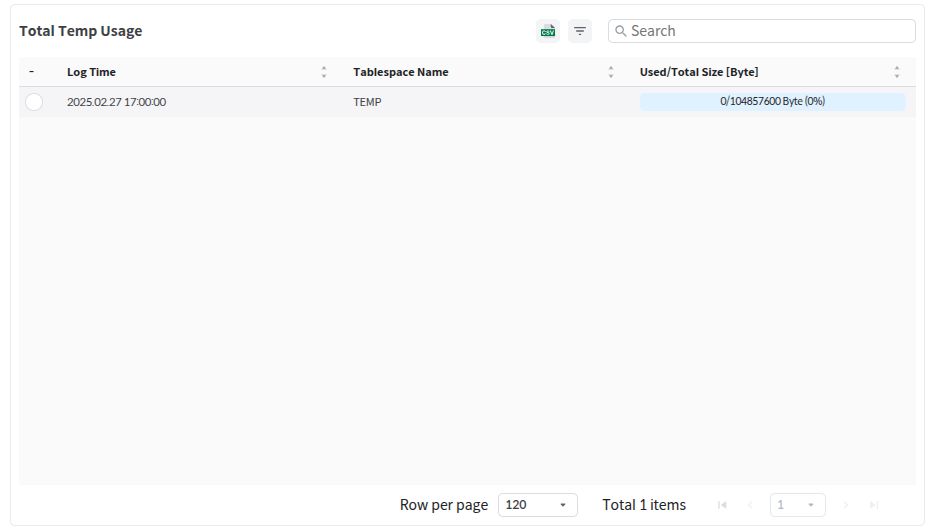
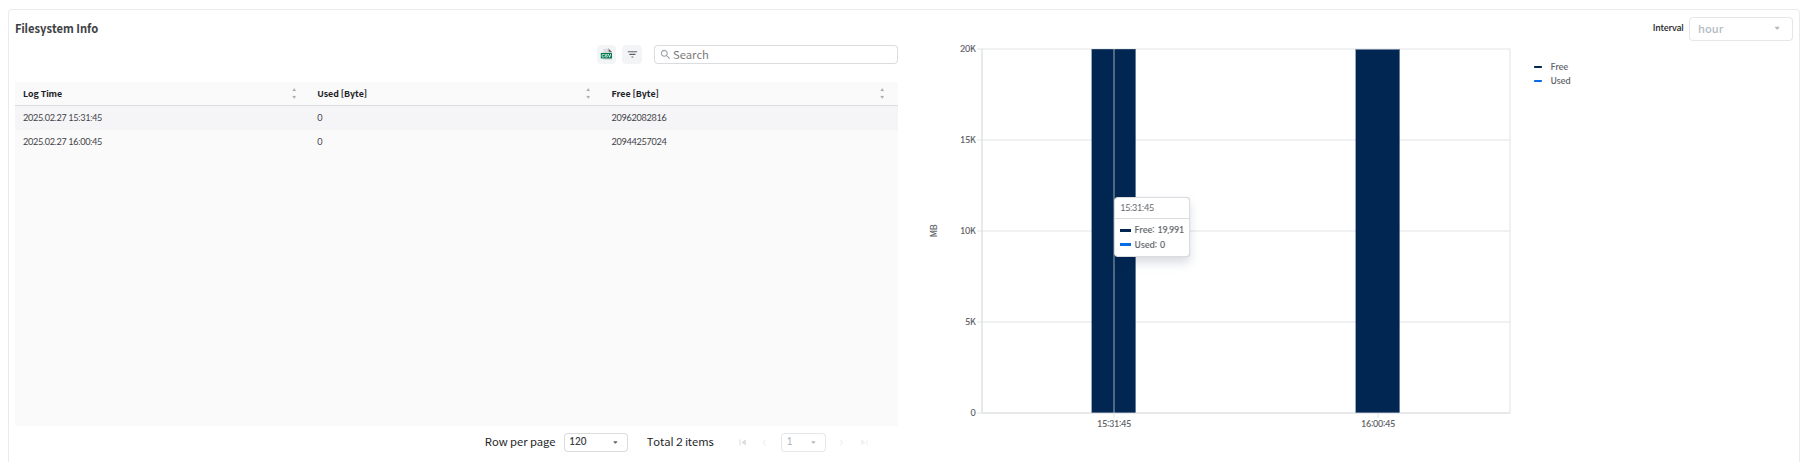
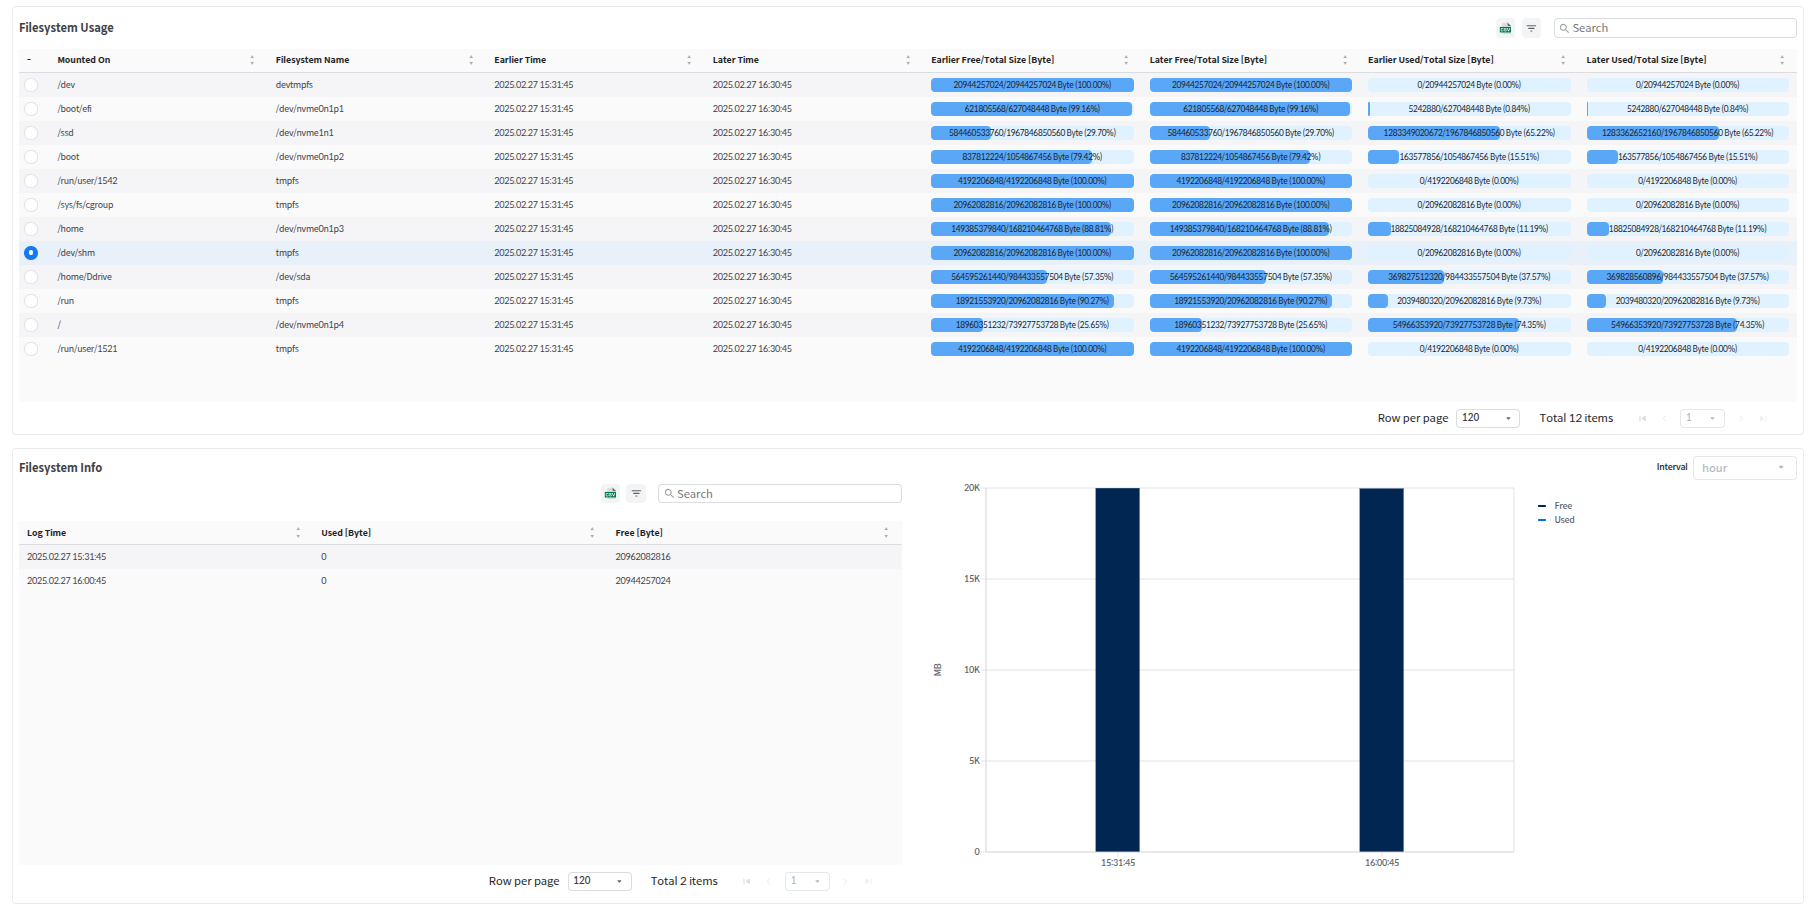
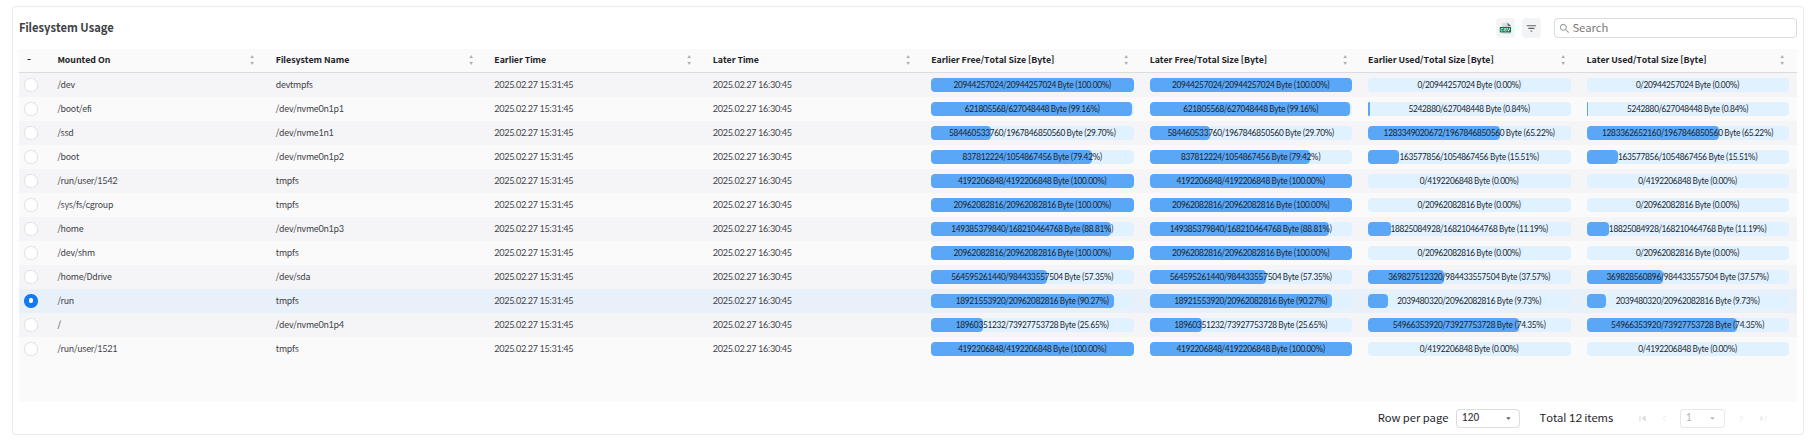
GLIBC_2.17 or later
1) OPEN_MODE에 value 추가
- READ ONLY WITH APPLY
2) PROTECTION_MODE
: Protection mode currently in effect for the database
- UNPROTECTED
- PROTECTION
- AVAILABILITY
- PERFORMANCE
3) DATABASE_ROLE
: Current role of the database
- PRIMARY
- PHYSICAL STANDBY
- LOGICAL STANDBY (TODO)
- SNAPSHOT STANDBY
- CASCADING STANDBY
4) STANDBY_BECAME_PRIMARY_TSN
: TSN at which the physical standby database became primary
5) STANDBY_BECAME_PRIMARY_DATE
: Time at which the physical standby database became primaryIP address that can connect to the SysMaster DB server
O
agent-config
port
Port number for the TPM Agent to connect to the COLLECTOR_PORT of the SysMaster DB server
O
agent-config
freq
Collection interval (unit: msec)
[Note] If not set, it is set to 1000ms, resulting in a collection interval of 1 second.
X
agent-config
charset
Character set of the monitoring DB (confirmed via the NLS_CHARACTERSET parameter)
[Note] If not set, it is set to utf-8.
X
agent-config
cpu-mem-proc-freq
Collection interval for CPU, memory, and process list information (unit: ms) [Note] If not set, it is set to the "freq" value.
X
agent-config
disk-freq
The interval for retrieving disk information (unit: ms)
[Note] If not set, it is set to "freq × 60," and if set, collection proceeds at the specified interval.
X
agent-config
session-freq
The interval for retrieving session information (unit: ms)
[Note] If not set, it is set to the "freq" value.
X
agent-config
dbsysinfo-freq
The interval for retrieving system metric information from the monitoring DB (unit: ms)
[Note] If not set, it is set to the "freq" value.
X
agent-config
sqltrace-freq
The interval for retrieving SQL Trace information (unit: ms)
[Note] If not set, it is set to the "freq" value.
X
log
level
Log level:
FATAL
ERROR
WARN
X
log
rotate-time-interval
The interval at which log files are archived (unit: h)
Archives the current log file at each interval and writes to a new log file
[Note] If not set, it is set to 24, archiving log files daily.
X
log
rotate-file-size
File size of archived log files (unit: MB)
When the log file reaches this size, the log file is archived and new log files are loaded.
[Note] If not set, it is set to 50, so log file archiving occurs when the log file reaches 50 MB.
X
log
max-log-file-number
Maximum number of archived files (unit: number)
When the number of archived files reaches the maximum, the oldest log files are deleted.
[Note] If not set, the default value is 7, so the maximum number of log files is 7.
X
log
path
Log file creation directory
[Note] If not set, the path is set to "tpmagent.jar" followed by "logs/"
X
UTF-16
SHIFT-JIS
JA16SJIS
JA16SJISTILDE
JA16EUC
JA16EUCTILDE
VN8VN3
GBK
WE8MSWIN1252
ZHT16HKSCS
CL8MSWIN1251
WE8ISO8859P1
EE8ISO8859P2
WE8ISO8859P9
WE8ISO8859P15
CL8KOI8R
CL8ISO8859P5
CP866
TH8TISASCII
EL8MSWIN1253
EL8ISO8859P7
AR8MSWIN1256
AR8ISO8859P6
SJISTILDE
ZHT16BIG5
ZHT16MSWIN950
GB18030
IW8ISO8859P8
EUC-TW
ENABLE_GC_LOG
Environment variable that determines whether to generate a JVM GC log file when running the TPM Agent. The default value is false.
X
JAVA_MIN_HEAP_SIZE
Environment variable for setting the initial heap size when running TPM Agent. The default value varies depending on the JVM implementation and is typically 1/64 of the current machine memory.
X
JAVA_MAX_HEAP_SIZE
Environment variable for setting the maximum heap size when running the TPM Agent. The default value varies depending on the JVM implementation and is typically 1/4 of the current machine memory.
X
agent-config
id
Instance ID
[Note] Must be the same as the INSTANCE ID value entered when registering the monitoring database instance in the web UI. Incorrect input will result in monitoring of incorrect Tibero installation machine status, session lists, and TSC network configurations, so please be careful.
O
agent-config
export BOOT_WITH_AUTO_DOWN_CLEAN=true
export ENABLE_DEBUG=false
export ENABLE_GC_LOG=false
export JAVA_MIN_HEAP_SIZE=300m
export JAVA_MAX_HEAP_SIZE=300mBOOT_WITH_AUTO_DOWN_CLEAN
Environment variable that determines whether to terminate existing processes and then execute the TPM Agent, if any are running. The default value is true.
X
ENABLE_DEBUG
Environment variable that determines whether to open the debug port when running the TPM Agent. The default value is false.
X
Note
The current Java TPM Agent supports the same Tibero jdbc Charset.
Note
Based on Tibero's maximum session count of 2000 sessions, the default heap size is 300MB. If the session count exceeds this limit, the maximum heap size must be increased. It is recommended to increase the heap size by 100MB for every 1000 additional sessions.
ip
Previous SQL ID
SQL ID of the SQL previously executed by the session
REDO_LOG_SIZE
Redo log size
REDO_WRITE_MULTI
Number of times when multiple sessions request to write the contents of the Redo log buffer
USER_ROLLBACKS
Number of times a user has requested a rollback
SERIAL_NUMBER
The serial number of the session
CONSISTENT_BLOCK_GETS_EXAMINE_NOWAIT
Number of times nowait was used for Consistent Read Mode examine
CURRENT_BLOCK_GETS
Number of times the data of the block in the current state has been read (current block gets: a number related to finding and pinning the latest version of the block in the buffer cache)
REQ_SERVICE_TIME
DB Time (total time spent by actual working threads)
CURRENT_BLOCK_GETS_EXAMINE
The number of times the Current examine feature is used to quickly obtain index branch peep or data block row lock information without pinning the block
BLOCK_DISK_READ
Time spent waiting for a block to be read from disk and loaded into the buffer cache
EXECUTE_COUNT
The number of times an SQL statement has been executed
CONSISTENT_BLOCK_GETS_EXAMINE
The number of times the Consistent Read (CR) examine function was used to quickly obtain the required values without pinning in index block unique key searches, etc.
REDO_WRITE
Time taken to write log blocks from the redo buffer to disk
LOGICAL_READS
The number of blocks read via memory I/O
HARD_PARSE_COUNT
Number of hard parses
PHYSICAL_READS
Number of blocks read via disk I/O
DB_CPU_TIME
CPU usage time
CONSISTENT_BLOCK_GETS
Number of blocks read in Consistent Read (CR) mode
PHYSICAL_WRITE
Number of blocks written to disk
Buffer Cache Hit
Buffer Cache hit rate
CONSISTENT_MULTI_BLOCK_GETS
Number of times CONSISTENT_BLOCK_GETS was performed on multiple blocks
Number of CURRENT_BLOCK_GETS_EXAMINE_NOWAIT
Number of times current block gets examine was performed without waiting
USER_COMMIT
Number of user commits in the session
CURRENT_BLOCK_GETS_NOWAIT
Number of times current block gets were performed without waiting (number of times current block gets were performed without waiting)
MULTI_BLOCK_DISK_READ
Number of times Multi Block was read from disk
Wait time
The time spent waiting for the wait event that occurred in the current session
SQL ID
SQL ID of the SQL being executed by the session
Previous Child Number
Child Number value of the SQL that was previously executed in the session
Child Number
Child Number value of the SQL being executed by the session
∑
Cumulative values for each Statistics indicator in the session
Delta
The change value before and after refreshing the Statistics indicator for the session
Value/Sec
Delta value divided by the refresh time (in seconds)
CONSISTENT_BLOCK_GETS_READONLY_PIN
Number of times consistent block gets were performed on read-only blocks
TOTAL_PARSE_COUNT
Total number of parses
REDO_ENTRIES
Number of redo entries (Redo entries: Redo records written by the session to the log buffer)
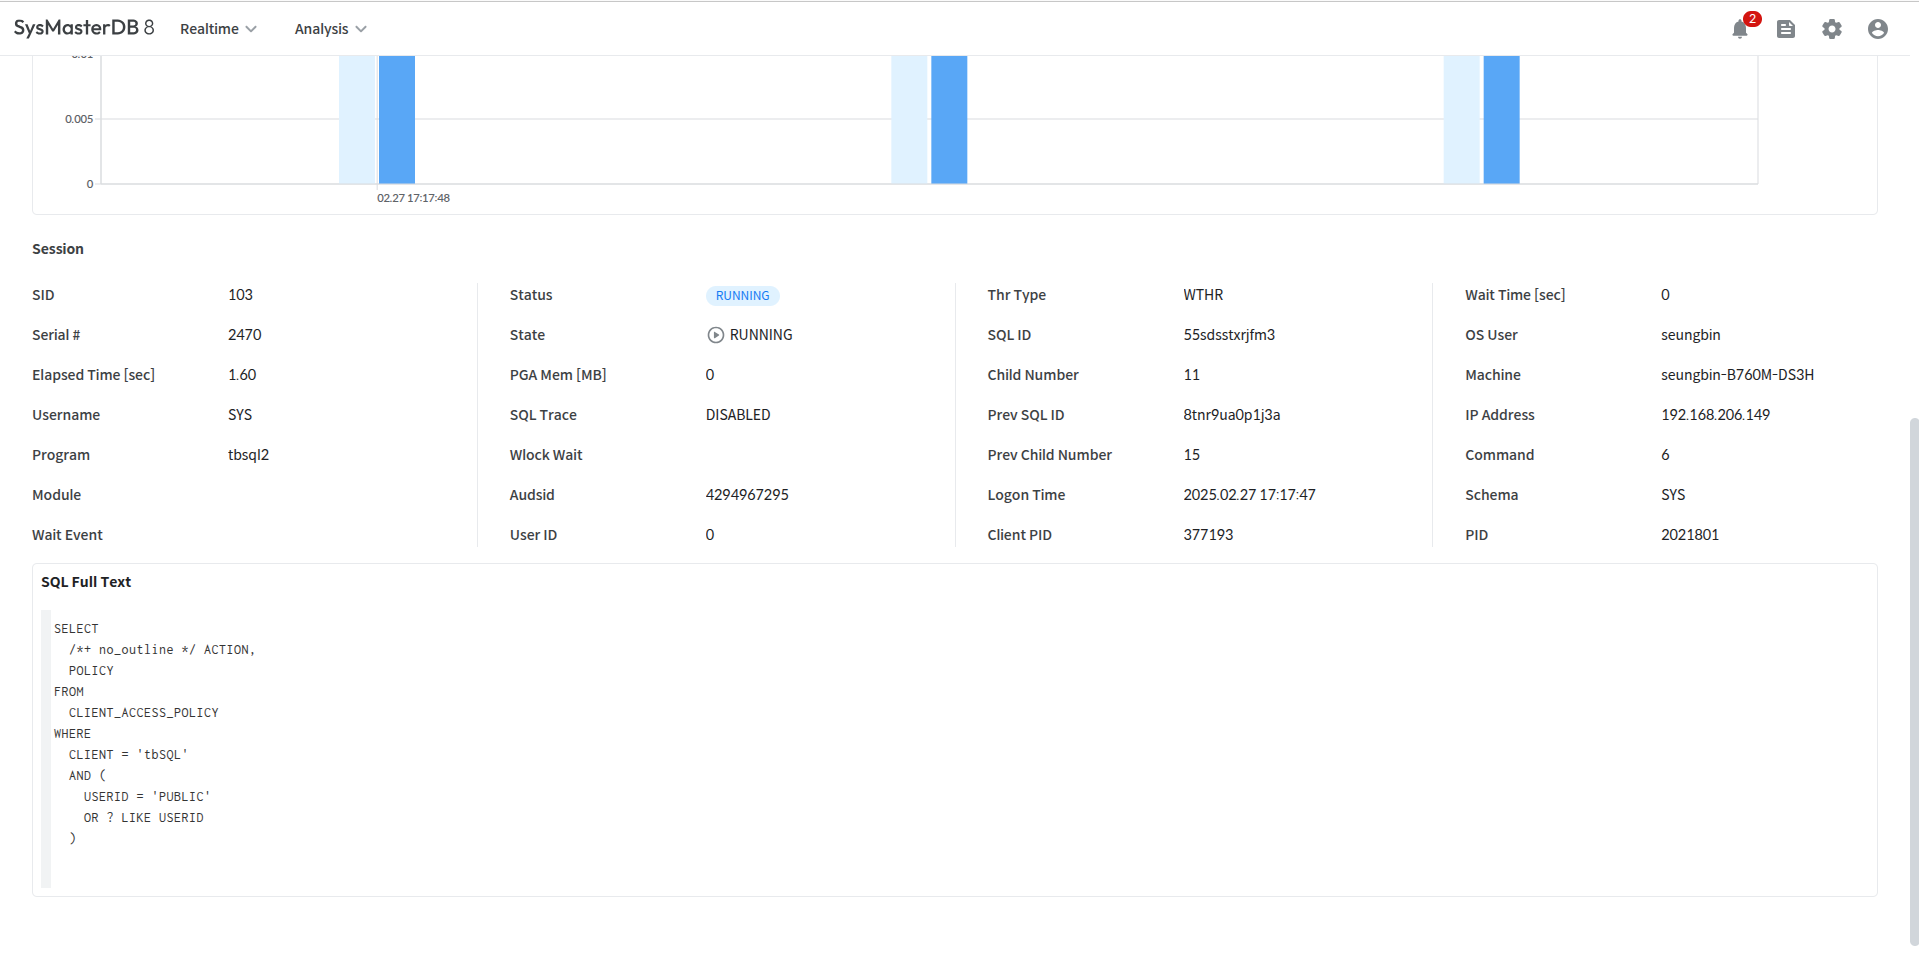
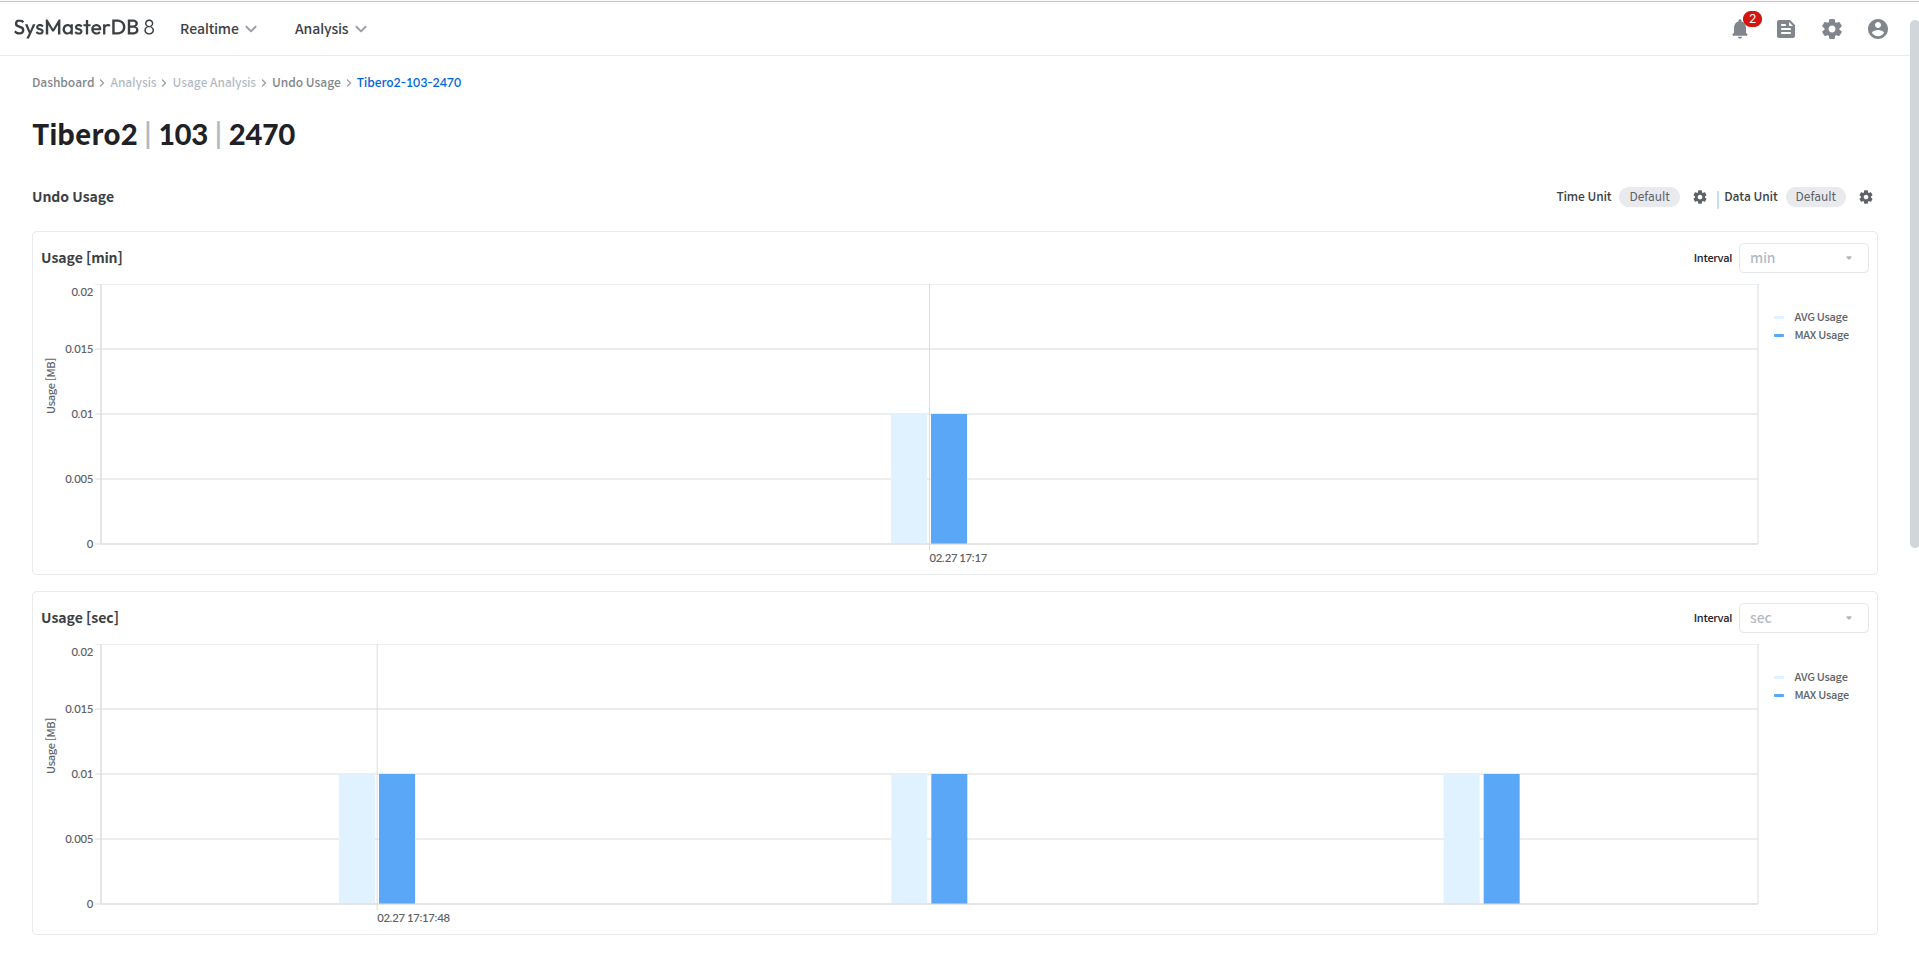
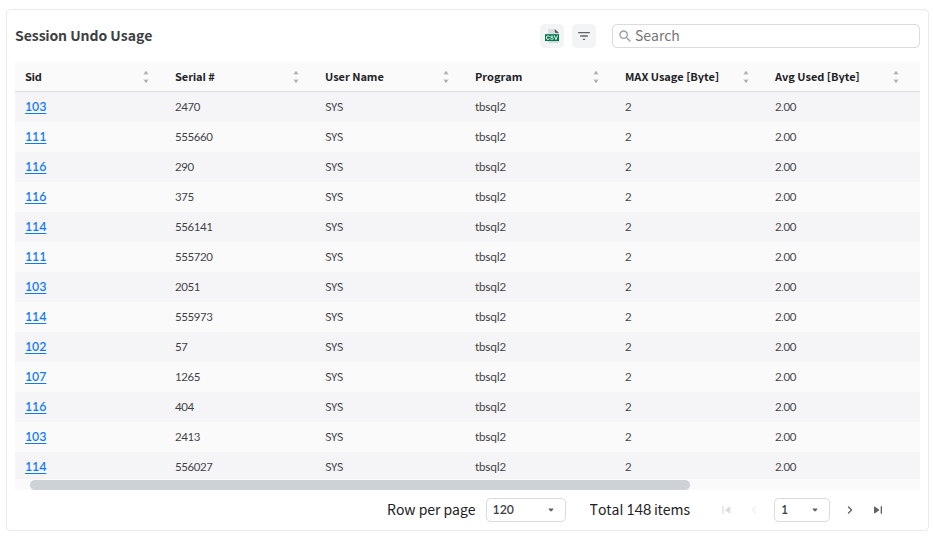
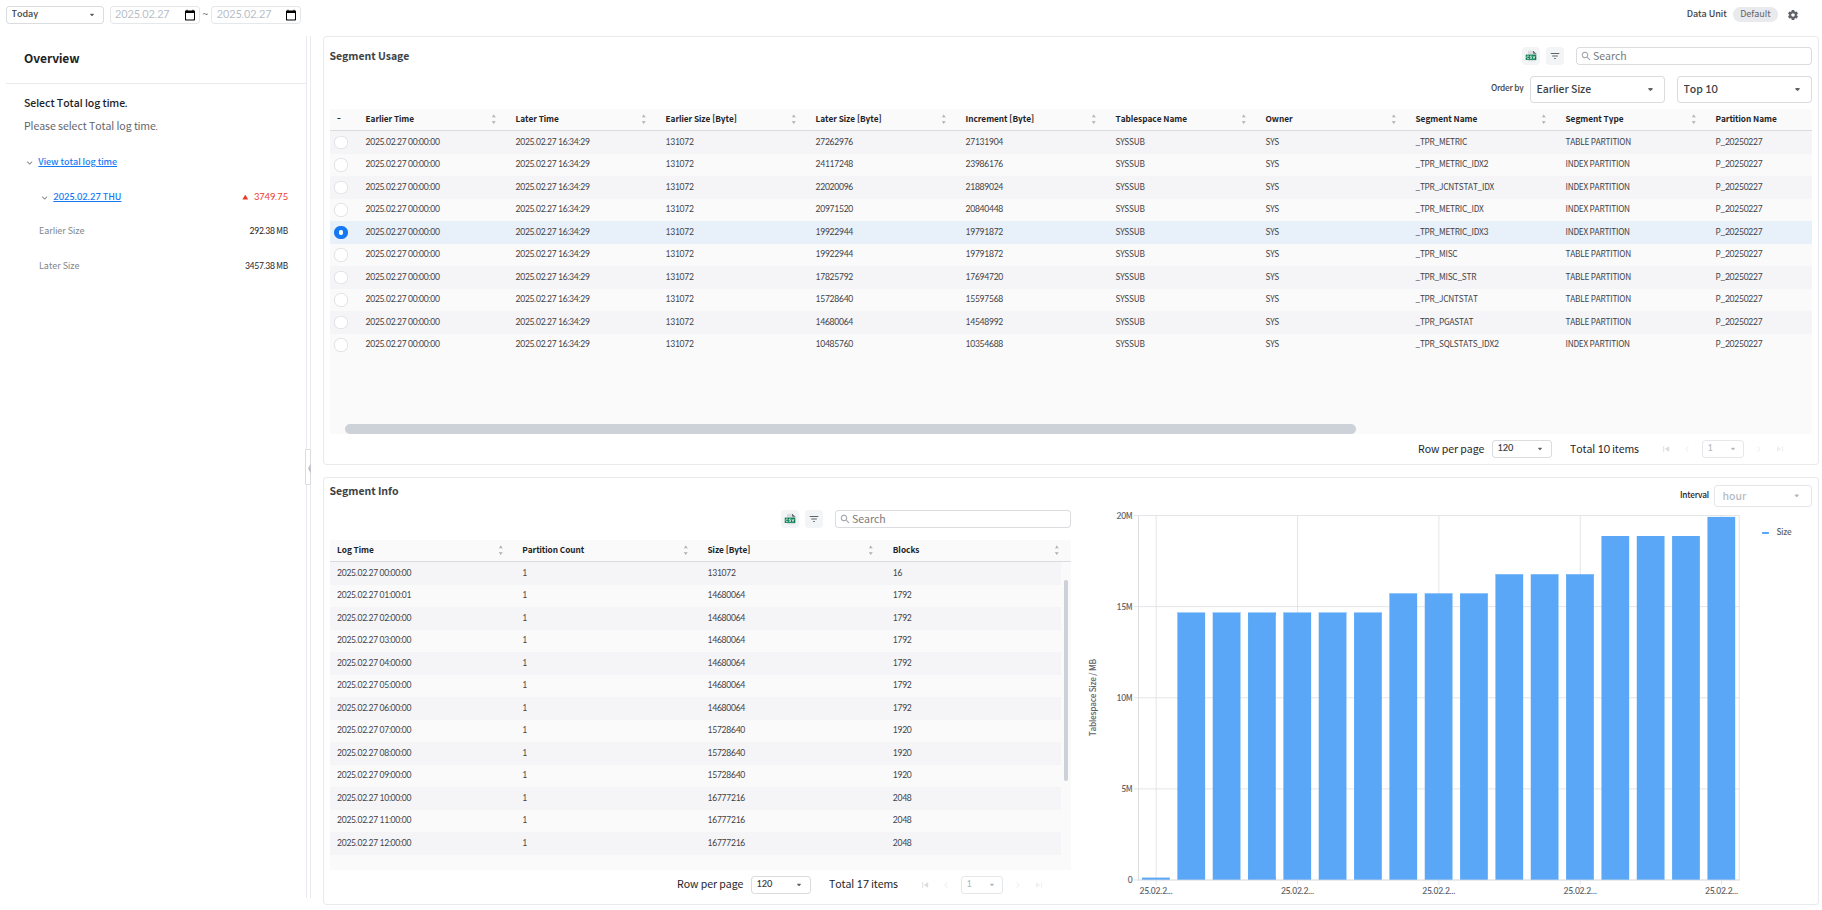
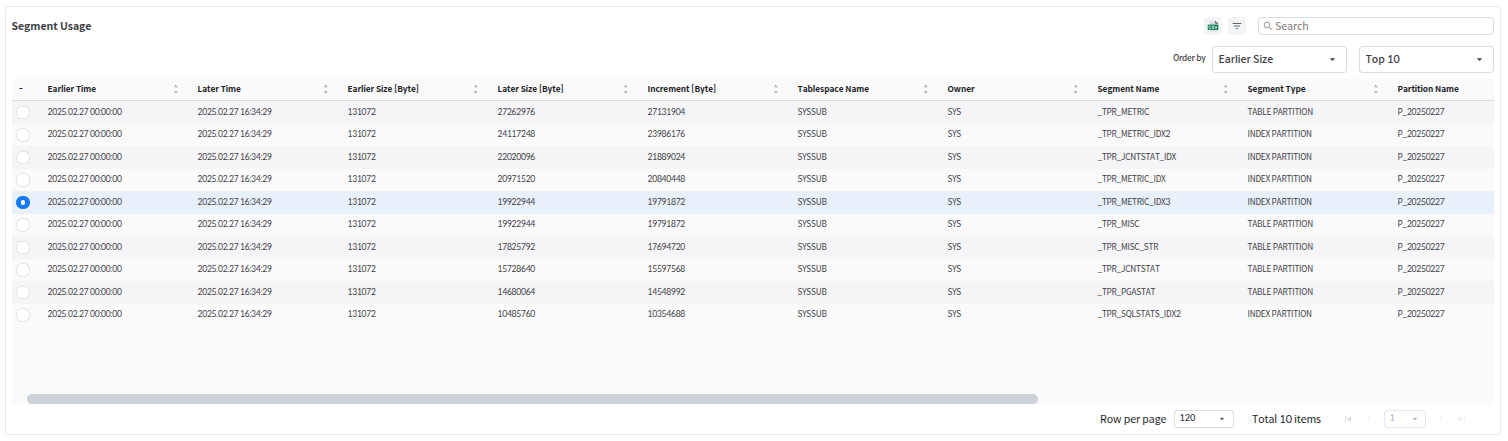
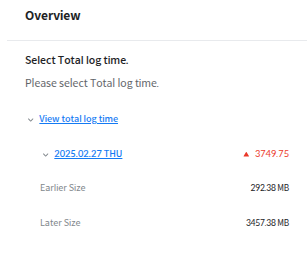
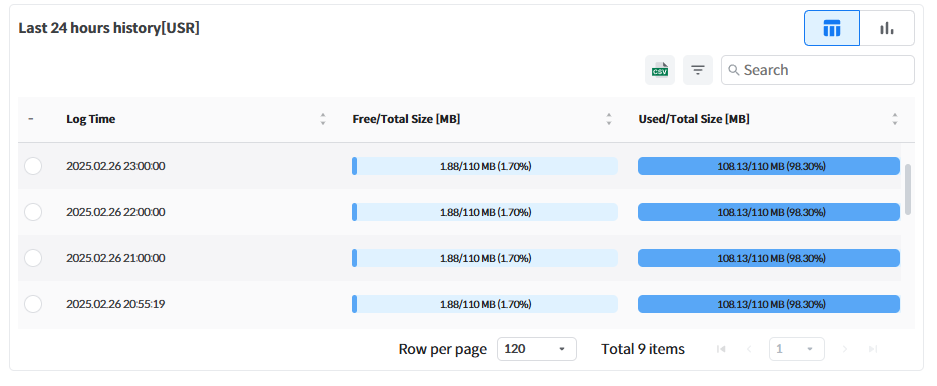
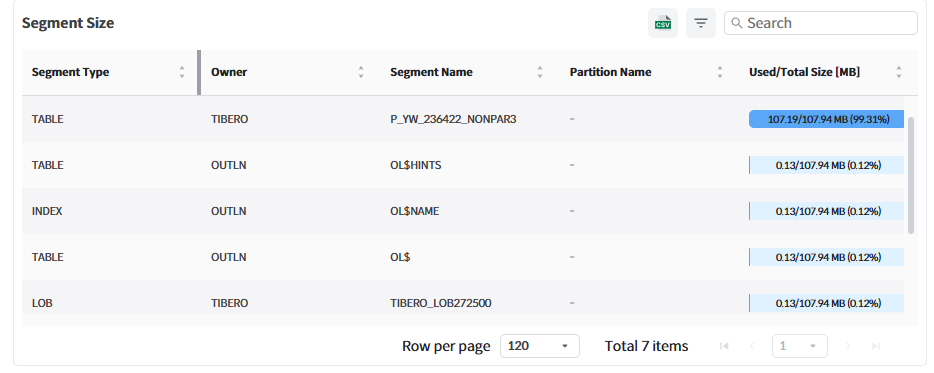
Click [Realtime] > [Main Monitoring] > [Session Monitoring] in the global navigation bar to open the Session Monitoring page.
The Session Monitoring page displays session information directly retrieved from the monitored DB via the collection agent, showing real-time metrics such as logical reads, physical reads, execute counts, and hard parses for each currently connected session.
Filtering functionality is provided by column (e.g., SID, user name, program), and users can monitor detailed information for each session by linking to the session details view. Users granted the [Kill Session] permission for the selected instance in Configurable Privileges can terminate sessions for that instance.
Displays session information for each session in the monitored database in a table format, with the last update time specified to indicate the current time of the information.
INFO
DEBUG
TRACE
[Note] If not set, it is set to INFO.
If set to DEBUG or higher, the log volume may increase, causing data loss due to failure to collect data within the interval set for the TPM Agent. As a result, data may not be displayed during real-time data monitoring. Therefore, it is recommended not to set this option in production environments, and to set the log level only for issue analysis.
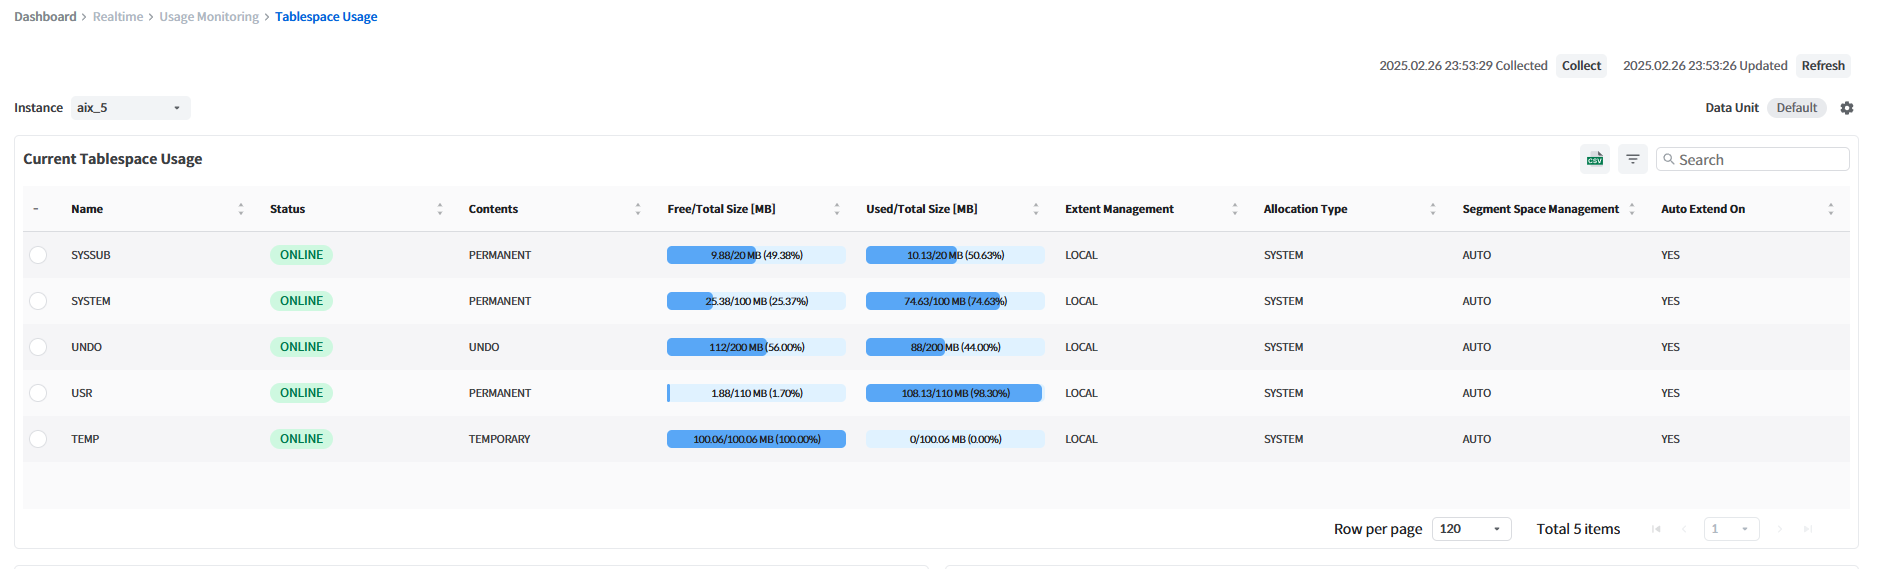
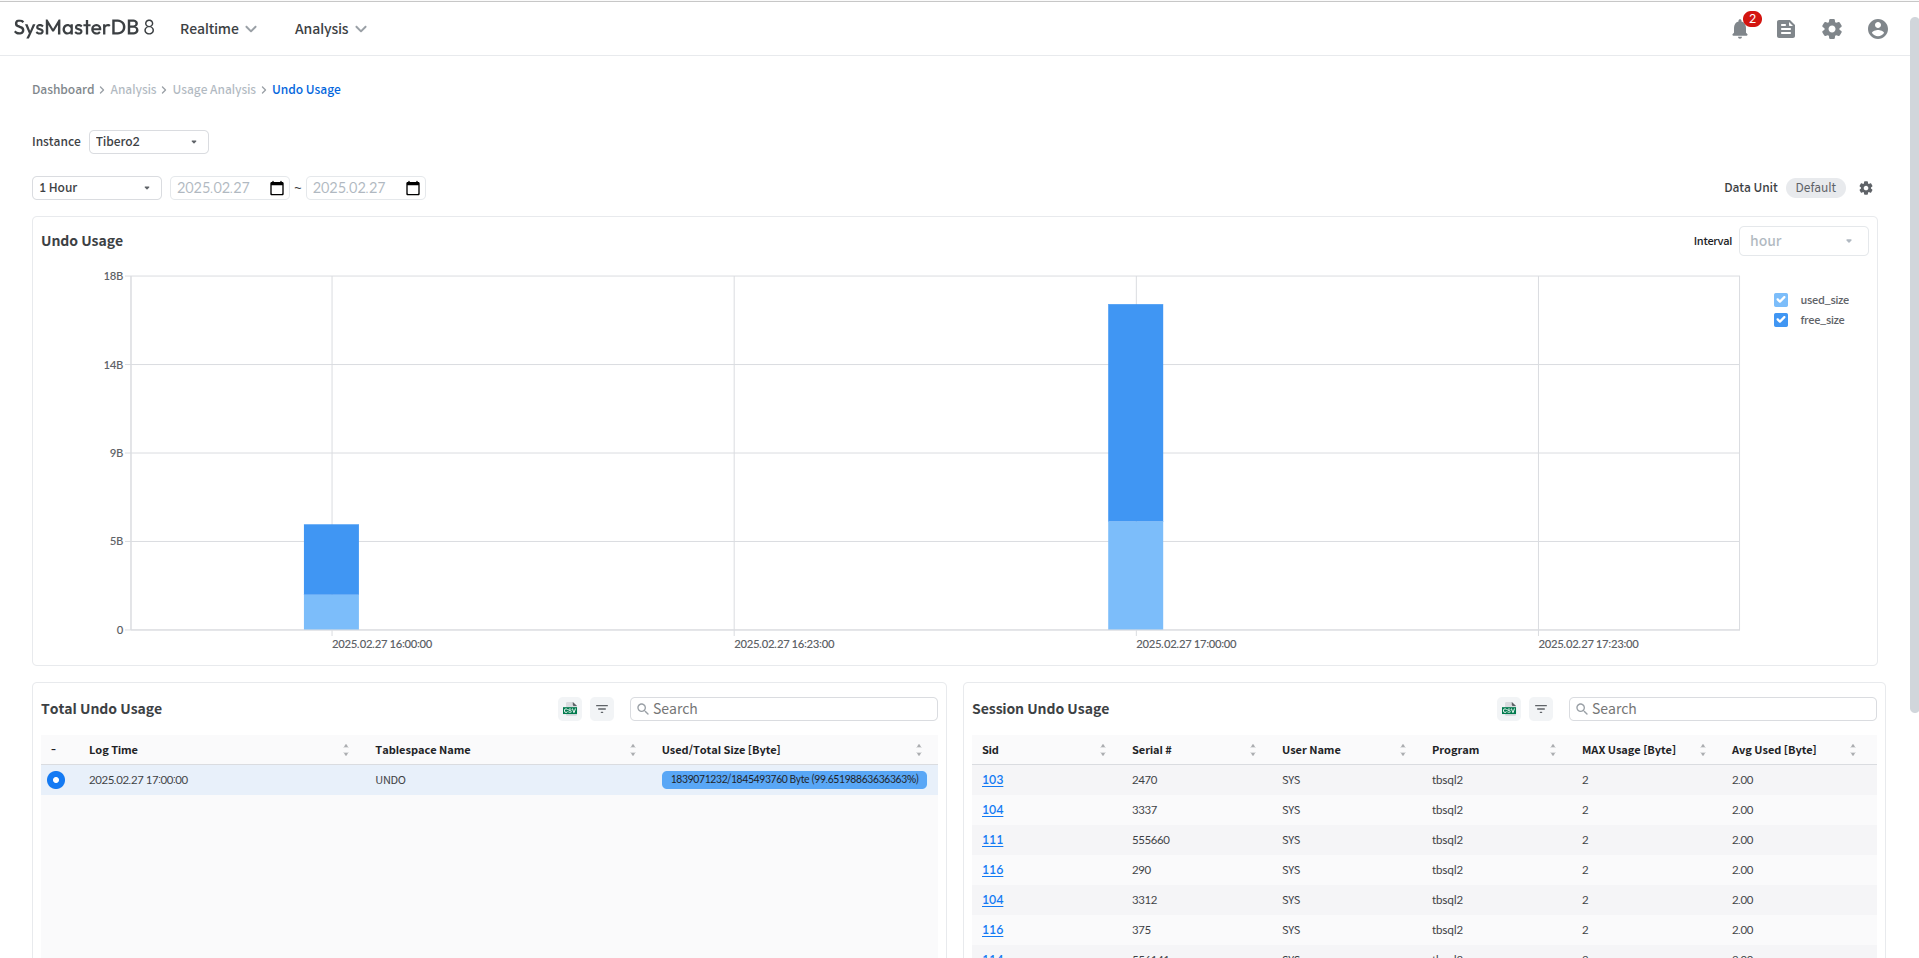
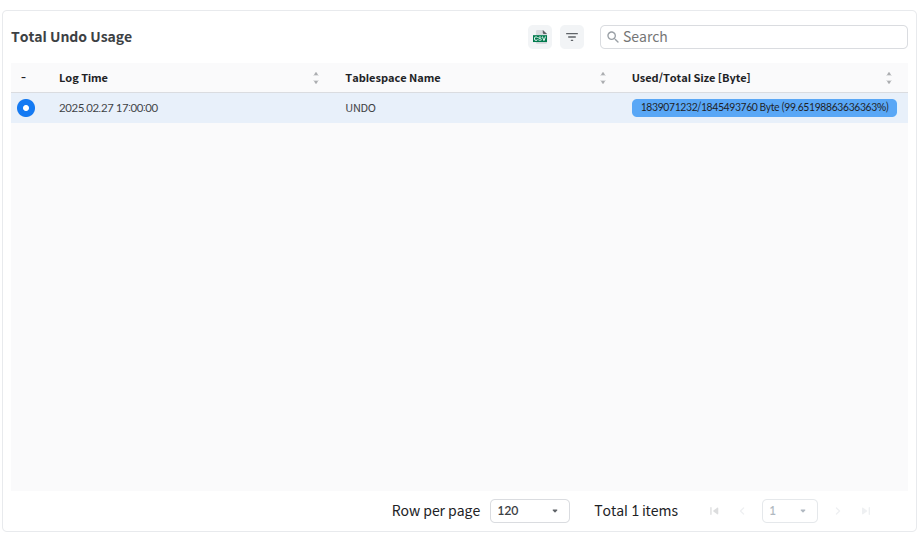
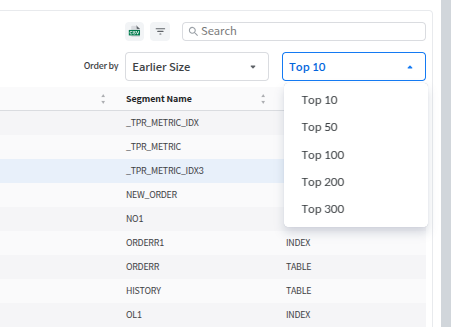
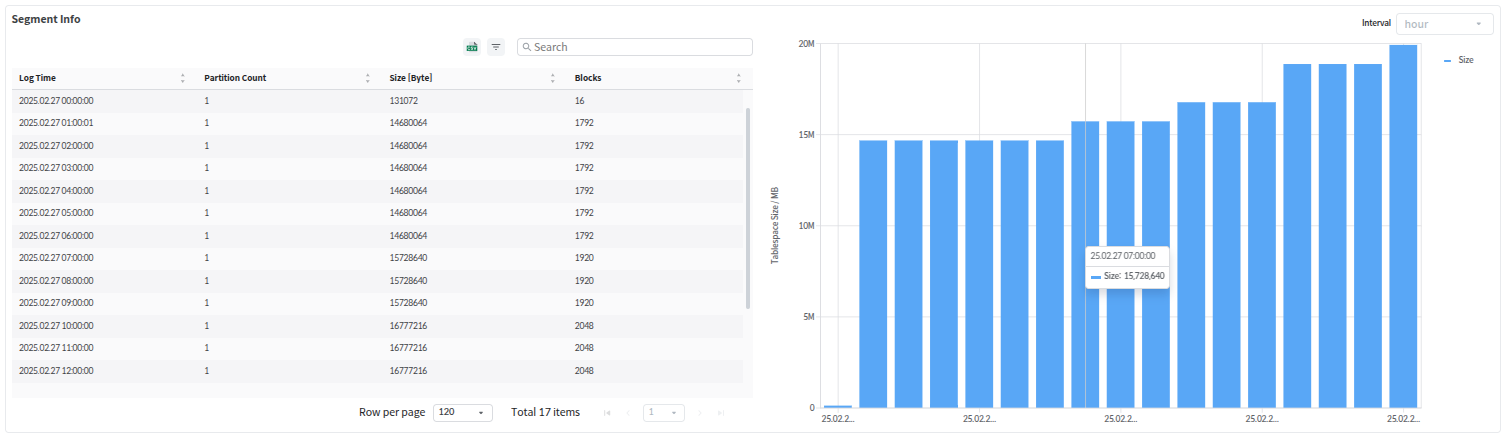
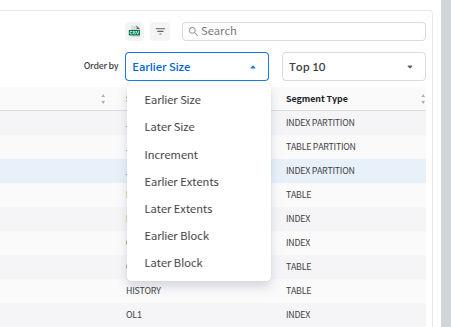
SID
Session ID
Serial#
Serial number of the session
Elapsed Time
Elapsed time of the SQL currently being executed in the session
Username
Users can set the Elapsed Time threshold, and sessions that have been running for longer than the specified duration can be visually identified by color.
The users can terminate a session. This action is only available to users with Full privileges for the Session Monitoring feature, and the button will only appear when a specific session is selected in the session list.
Clicking the [Kill Session] button opens the Kill Session pop-up window, where the users can either kill the session or cancel the action.
The following is a description of the information provided in the Kill Session pop-up window.
SID / Serial#
Session ID / Session serial number
Status
Session status
User Name
Session user name
Note
Due to an issue with the Tibero library used for collecting session information, some information such as Username, Program, Module, Schema, Terminal, Machine, and OS User may not be collected.
Note
The users can terminate the sessions of the instance (Session Kill). This feature is available only to users who have been granted the [Kill Session] permission for the selected instance in the Configurable Privileges.
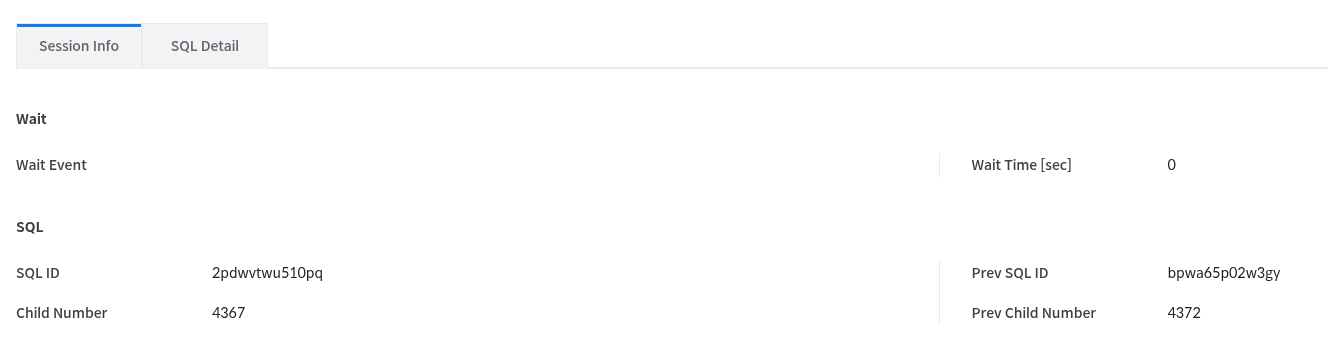
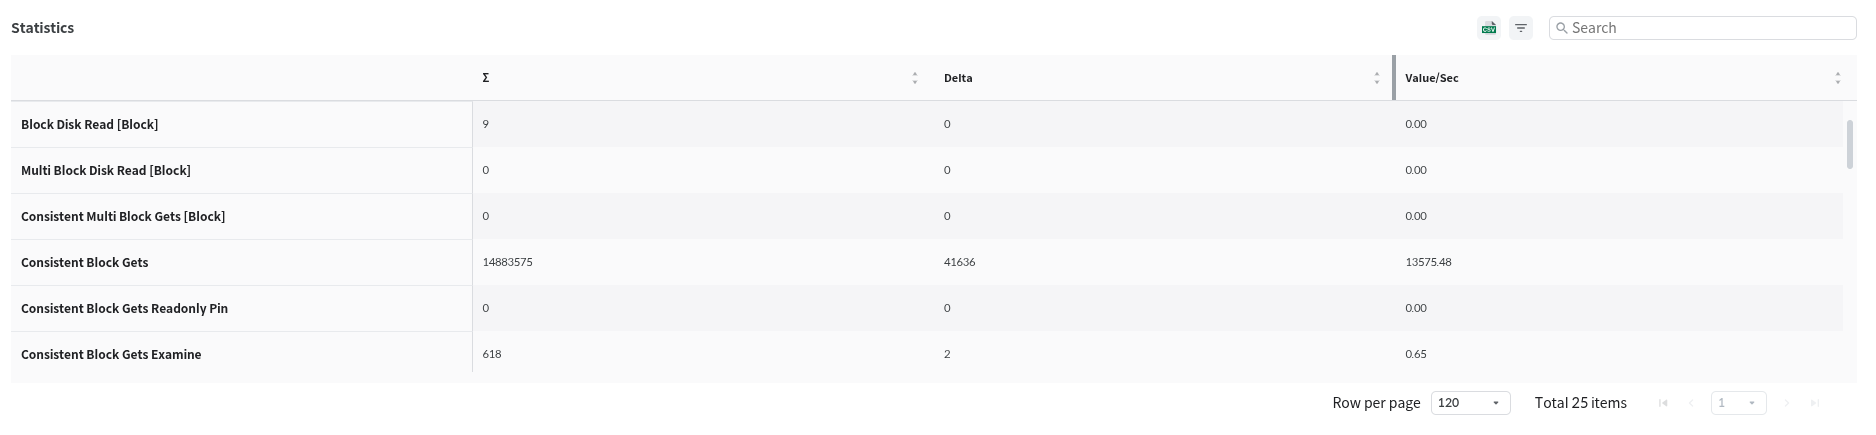
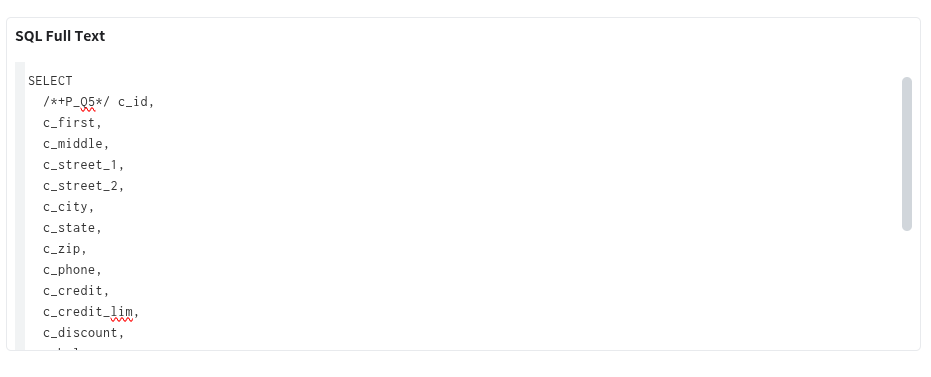
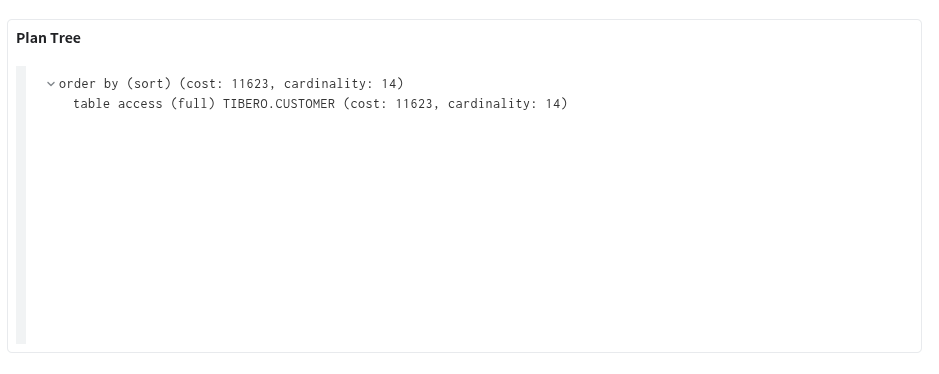
Current user name
Program
The name of the program in the session
Module
The name of the module specified by dbms_application_info.set_module
Logical Reads
The Logical Reads value of the session
Physical Reads
The Physical Reads value of the session
Execute Count
Execute Count value for the session
Hard Parse Count
Hard Parse value for the session
Wait Event
Wait Event name for the session
Wait Time
The time the session waited for the Wait Event
Status
The status of the session
READY: Session ready status
RUNNING: Session running status
TX_RECOVERING: Transaction recovery in progress status
SESS_CLEANUP: Session resource cleanup in progress state
ASSIGNED: Session thread assigned but not yet ready state
CLOSING: Session closed state
ROLLING_BACK: PE specification level transaction slave rolled back state
State
Work thread status
INVALID: Not initialized
NEW: Being created
IDLE: Ready to run
RUNNING: Running
WAITING: Waiting for internal message
RECV_WAITING: Waiting for client message
STOP_BY_MTHR: Stopped by monitoring process
DEAD: Dead state
PGA Used Memory
Session's PGA memory usage
SQL Trace
Whether to enable SQL tracing in the session
WLock Wait
Wait type that the session is waiting for
Redo Entries
Redo Entries value of the session
Tx Undo Block Count
Number of transaction undo blocks
Tx Undo Record Count
Number of transaction undo records
User Commits
Session User Commits value
Audsid
Second serial number of the session
User ID
User ID information
IP Address
User connection IP address
Command
Current SQL Type
0: No SQL running
1: SELECT
2: INSERT
3: UPDATE
4: DELETE
5: MERGE
6: CALL
Schema
Session Schema
Session Type
Session type
WTHR: Working thread
CTHR: Control thread
LGWR: Log writing process
CKPT: Checkpoint process
LARC: Log archive
AGENT: Sequence process
MTHR: Monitoring process
DBWR: Datablock writing process
LNW: Log network writing process
SQL ID
SQL ID of the SQL being executed by the session
Previous SQL ID
SQL ID of the last SQL executed
Child Number
Child Number value of the SQL ID being executed by the session
Previous Child Number
Child Number value of the last executed SQL ID
Logon Time
The logon time of the session
Client PID
Client PID of the session
PID
The identifier of the process to which the session belongs
OS User
OS account name of the connected session
Machine
Host name of the connected session
Terminal
Terminal (TTY) information for the connected session
Action
Name of the action specified by dbms_application_info.set_module/action
Client Info
The name of the client_info specified by dbms_application_info.set_client_info
Client Identifier
The name of the client ID specified by dbms_session.set_identifier
Program
Session program name
Module
Session module name
Wlock Wait
Wait type the session is waiting for
Machine
Host name of the connected session
This is the process of installing SysMaster DB in a Kubernetes environment.
Execute the following command in the directory where the installation files are prepared to load the Docker image.
docker load -i sysmaster-db-{version}.tar
The list of loaded Docker images is as follows.
sysmaster-db-client:{version}
sysmaster-db-sdm:{version}
sysmaster-db-tibero-master:{version}
sysmaster-db-collector:{version}
sysmaster-db-analyzer:{version}
sysmaster-db-tmaxopensql-postgres:{version}
sysmaster-db-schema-registry:{version}
sysmaster-db-kafka-loggable:{version}
sysmaster-db-zookeeper-loggable:{version}
sysmaster-db-alpine-linux:{version}
Push the loaded Docker images to the image repository used in the environment.
Define eight deployments using the YAML files in the kubernetes directory within the installation directory. The description of each deployment is as follows.
Open the kubernetes/init/configmap.yaml file in the installation directory and set the parameter values related to account information and retention period required for installing the SysMaster DB.
The following is a description of the parameters set in this process.
Open the kubernetes/init/service.yaml file in the installation directory and set the parameter values related to the ports required for installing SysMaster DB. The descriptions of the parameters set during this process are as follows.
The users can check the Meta DB and Repository DB parameter values in the kubernetes/init/configmap.yaml file in the installation directory. The following is an example of Meta DB parameter settings.
This conf file uses the default settings provided, but the parameters described below should be set by the user as needed to match the runtime environment.
collector
A server that collects data from the monitoring database
analyzer
A server that processes, analyzes, and stores collected information
metadb
DB server that stores UI-related setting information
repodb
Monitoring database DB server that stores collected data
kafka
Kafka cluster (including ZooKeeper, Broker, and Schema Registry)
METADB_USER
Meta DB super user name
sysmaster
METADB_PASSWORD
Meta DB super user password
sysmaster
REPODB_USER
Repository DB super user name
sysmaster
REPODB_PASSWORD
Repository DB super user password
sysmaster
RETENTION_DAY
Retention period for collected information
7
LOG_RETENTION_DAY
Log file retention period
1
LOG_FILE_SIZE
Maximum size of a single log file
100MB
LOG_TOTAL_SIZE
Maximum log storage capacity per module
1000MB
LOG_LEVEL
Maximum log level per module
info
CONTAINER_LOG_PATH
Set the log path inside the container
/sysmaster/logs
KAFKA_MESSAGE_MAX_BYTES
Set the Kafka message size, Can be set within the range of 1MB to 2GB
20971520 bytes
TIME_ZONE
SysMaster DB server time zone setting
Asia/Seoul
SQL_FLUSH_THRESHOLD
Limits the number of pieces of information that can be contained in a single SQL-related message. For SQL Plans, this value is limited to 10 times the specified value.
100 per monitoring DB
SQL_RS_FETCH_SIZE
The number of SQL-related information rows retrieved from the monitoring DB at one time.
1,000 per monitoring database
SKIP_DB_USER_COUNT_MIGRATION_PATCH
(When applying patches to an existing environment,) whether to skip the patch that creates the DB_USER_COUNT table data in the Repository DB based on previously collected data. If necessary, refer to [Note 1] below and configure accordingly.
true (disabled via comment)
SKIP_DAILY_SEGMENT_MIGRATION_PATCH
(When applying patches to an existing environment,) whether to skip the patch that creates data in the DAILY_SEGMENT table of the Repository DB based on existing data. If necessary, refer to [Reference 1] below and configure accordingly.
true (disabled via comment)
SKIP_V8_2_1_TO_V8_3_0_MIGRATION_PATCH
(When applying the patch to an existing environment,) whether to skip the migration of existing data collected in v8.2.1 or earlier for tables targeted by the new schema in v8.3.0. If necessary, refer to [Reference 2] below and configure accordingly.
true (disabled via comment)
RETENTION_DAY_FOR_V8_2_1_TO_V8_3_0_MIGRATION_PATCH
(When applying patches to an existing environment,) the migration scope (daily period) for data collected in v8.2.1 or earlier that is subject to migration in tables where the new schema has been applied in v8.3.0. If necessary, refer to [Note 2] below and configure accordingly.
7 (Not applied via comment)
SDM_HEAP_SIZE_MAX
Maximum heap size for SDM
1/4 of the total memory of the current container (refer to the "total mem" output of the "free" command). [Note] The current default Docker image is openjdk:17-alpine.
SDM_HEAP_SIZE_MIN
Minimum heap size for SDM
1/64 of the current container's total memory (refer to the total mem value from the free command). [Note] The current default Docker image is openjdk:17-alpine.
ANALYZER_HEAP_SIZE_MAX
Maximum heap size for the analyzer
1/4 of the current container's total memory (refer to the total mem value from the free command). [Note] The current default Docker image is openjdk:17-alpine.
ANALYZER_HEAP_SIZE_MIN
Analyzer's minimum heap size
1/64 of the current container's total memory (refer to the total mem value from the free command). [Note] The current default Docker image is openjdk:17-alpine.
COLLECTOR_HEAP_SIZE_MAX
Maximum heap size for the collector
It is currently 1/4 of the total container memory (refer to total mem in the free command). [Note] The current default Docker image is openjdk:17-alpine.
COLLECTOR_HEAP_SIZE_MIN
Minimum heap size for the collector
Currently, it is 1/64 of the total container memory (refer to the "total mem" output of the "free" command). [Note] The current default Docker image is openjdk:17-alpine.
TBM_HEAP_SIZE_MAX
Maximum heap size for TBM
1/4 of the current container's total memory (refer to the total mem value from the free command). [Note] The current default Docker image is openjdk:17-alpine.
TBM_HEAP_SIZE_MIN
Minimum heap size for TBM
It is 1/64 of the current container's total memory (refer to the total mem value from the free command). [Note] The current default Docker image is openjdk:17-alpine.
PERFORMANCE_LOGGING
Whether to enable performance-related logging [Note] Since this uses additional CPU and disk resources, setting this to Y may cause performance degradation.
N
LIMIT_SQL_HASH_COUNT
The maximum number of SQL plan hash value + cost combinations stored in memory to prevent duplicate collection, and the maximum number of SQL text hash values at the same time.
1 million [Note] This occupies approximately 300MB of memory.
METADB_PORT
Meta DB connection port number [Modification location] metadata.name=metadb, name="metadb-port" in ports nodePort modification
25432
REPODB_PORT
Repository DB connection port number [Modification location] metadata.name=repodb, name="repodb-port" in ports nodePort modification
15432
client
The web server that users will access through their browsers
sdm
An API server that queries collected information and communicates with clients
tibero-master
A server that performs status checks on the monitoring database and admin functions
apiVersion: v1
kind: ConfigMap
metadata:
name: config-sysmaster
namespace: sysmasterdb
data:
RETENTION_DAY: "7"
METADB_USER: sysmaster
METADB_PASSWORD: sysmaster
REPODB_USER: sysmaster
REPODB_PASSWORD: sysmaster
ADMIN_USERNAME: admin
ADMIN_PASSWORD: admin
LOG_RETENTION_DAY: "1"
LOG_FILE_SIZE: "100MB"
LOG_TOTAL_SIZE: "1000MB"
LOG_LEVEL: "info"
CONTAINER_LOG_PATH: "/sysmaster/logs"
KAFKA_MESSAGE_MAX_BYTES: "20971520"
TIME_ZONE: Asia/Seoul
SQL_FLUSH_THRESHOLD: 100
SQL_RS_FETCH_SIZE: 1000
# SKIP_DB_USER_COUNT_MIGRATION_PATCH: true
# SKIP_DAILY_SEGMENT_MIGRATION_PATCH: true
# SKIP_V8_2_1_TO_V8_3_0_MIGRATION_PATCH=true
# RETENTION_DAY_FOR_V8_2_1_TO_V8_3_0_MIGRATION_PATCH=7
SDM_HEAP_SIZE_MAX: ""
SDM_HEAP_SIZE_MIN: ""
ANALYZER_HEAP_SIZE_MAX: ""
ANALYZER_HEAP_SIZE_MIN: ""
COLLECTOR_HEAP_SIZE_MAX: ""
COLLECTOR_HEAP_SIZE_MIN: ""
TBM_HEAP_SIZE_MAX: ""
TBM_HEAP_SIZE_MIN: ""
PERFORMANCE_LOGGING: ""
LIMIT_SQL_HASH_COUNT: ""ADMIN_USERNAME
Admin account username
admin
ADMIN_PASSWORD
Password for the admin account
admin
CLIENT_PORT
Port number for the UI access URL [Modification location] Modify the nodePort in the ports section where metadata.name=client, name="client-port"
COLLECTOR_PORT
The port number for the collection module (TPM Agent) to connect to [Modification location] Modify the nodePort of the ports with metadata.name=collector, name="collector-port" [Note] Must be open on the SysMaster server to allow access from the monitoring DB.
82
apiVersion: v1
kind: ConfigMap
metadata:
name: sysmasterdb8-metadb-configmap
namespace: sysmasterdb
data:
meta.conf: |
pg_superuser: "postgres"
pg_superuser_password: "postgres"
pg_data: "/pgdata"
pg_log: "/sysmaster/logs"
pg_users:
- name: "sysmaster"
pass: "sysmaster"
role_attr_flags: LOGIN
pg_databases:
- name: metadb
owner: sysmaster
pg_max_connections: 20
pg_postgres_conf_params:
- name: "log_filename"
value: "metadb-%H%M.log"
- name: "log_timezone"
value: "Asia/Seoul"
- name: "log_min_messages"
value: "INFO"
- name: "log_rotation_age"
value: "60"
- name: "log_rotation_size"
value: "100MB"
- name: "log_truncate_on_rotation"
value: "on"pg_max_connections
Maximum number of connections to the Meta DB (or Repository DB)
log_timezone
Time zone for logs in the Meta DB (or Repository DB)
Note
SKIP_DAILY_SEGMENT_MIGRATION_PATCH parameters are not required for new installations and are only applicable when performing a version update in an existing environment with SysMaster DB v8.1.2 or earlier.
If these parameters are not set individually, the patch will be automatically applied during the version update, generating DB_USER_COUNT and DAILY_SEGMENT data based on the existing data.
However, depending on the amount of existing data, the patch execution may take a significant amount of time. Therefore, users can optionally enable or disable the patch execution using this parameter.
When using the SysMaster DB service version 8.1.3 or higher, the DB_USER_COUNT and DAILY_SEGMENT data are used in the following menus, respectively.
1. DB_USER_COUNT data - Analysis > All Session Flow menu
2. DAILY_SEGMENT data - Analysis > Segment Usage menu
Therefore, if the users configure the patch to be skipped (set each parameter to true and remove the comment), the data from the past (collected before the update) will not be displayed in the menus mentioned in 1 and 2 above. Therefore, it is recommended to leave these parameters unchanged by default.
However, in the following cases, users can set the relevant parameters to true (remove comments) to skip the previously described patch.
When viewing past data (collected in SysMaster DB v8.1.2 or earlier) in the menus mentioned in steps 1 and 2 is unnecessary.
If there is concern that the SysMaster DB server resources may be insufficient during the data creation patch process, resulting in prolonged unavailability of the SysMaster DB, and this must be prevented.
Users can selectively set only the desired parameter among the two parameters as needed.
Note
The SKIP_V8_2_1_TO_V8_3_0_MIGRATION_PATCH and RETENTION_DAY_FOR_V8_2_1_TO_V8_3_0_MIGRATION_PATCH parameters are not required for new installations and are only applicable when performing a version update in an environment where SysMaster DB v8.2.1 or earlier is already installed.
If these parameters are not set individually, a patch will automatically migrate data collected in versions prior to v8.2.1 to tables with the new schema applied in v8.3.0.
The list of tables with the new schema applied in v8.3.0 is as follows.
SQL
SQL_TEXT
SQL_PLAN
DB_SESSION
SESSION_TEMP
SESSION_UNDO
LOCK
SQL_TRACE
The migration process for the above tables may take a long time depending on the amount of data collected.
Users can optionally enable or disable the execution of the patch by configuring the following parameters as needed.
SKIP_V8_2_1_TO_V8_3_0_MIGRATION_PATCH
Set whether to perform the patch that migrates data from versions prior to v8.2.1 to the new schema applied in v8.3.0 for tables with the new schema.
If the SKIP_V8_2_1_TO_V8_3_0_MIGRATION_PATCH parameter is set to true (comment removed), migration will not be performed on all tables targeted by the patch.
If migration is not performed using the SKIP_V8_2_1_TO_V8_3_0_MIGRATION_PATCH setting, data collected in v8.2.1 or earlier will be deleted and will no longer be available for retrieval.
Therefore, it is recommended not to set this parameter separately by default.
However, in the following cases, users may consider skipping the migration:
If there is no need to view past data (collected in SysMaster DB v8.2.1 or earlier) from tables subject to the new schema in v8.3.0
If there are concerns that the SysMaster DB server resources may be insufficient during the data creation patch process, resulting in prolonged unavailability of the SysMaster DB, and this must be prevented.
In such cases, users can set the following parameter to perform the migration patch while separately specifying the data scope (daily period) for the patch execution.
RETENTION_DAY_FOR_V8_2_1_TO_V8_3_0_MIGRATION_PATCH
Set the migration target data range (daily period) for data collected prior to v8.2.1 that is subject to migration in tables where the new schema has been applied in v8.3.0
For example, if the RETENTION_DAY_FOR_V8_2_1_TO_V8_3_0_MIGRATION_PATCH parameter is set to 7 (comment removed), migration will only be performed on data collected in v8.2.1 or earlier within the last 7 days.
Refer to the above description to select and apply the appropriate parameter settings for the usersr production environment.
Note
If the users need to change the parameters for Meta DB and Repository DB, refer to the TmaxOpenSQL User Guide for related parameter settings. However, if the users arbitrarily modify the related parameters, the normal operation of the SysMasterDB server is not guaranteed. Therefore, we recommend using the default settings for parameters other than those specified in the table above.
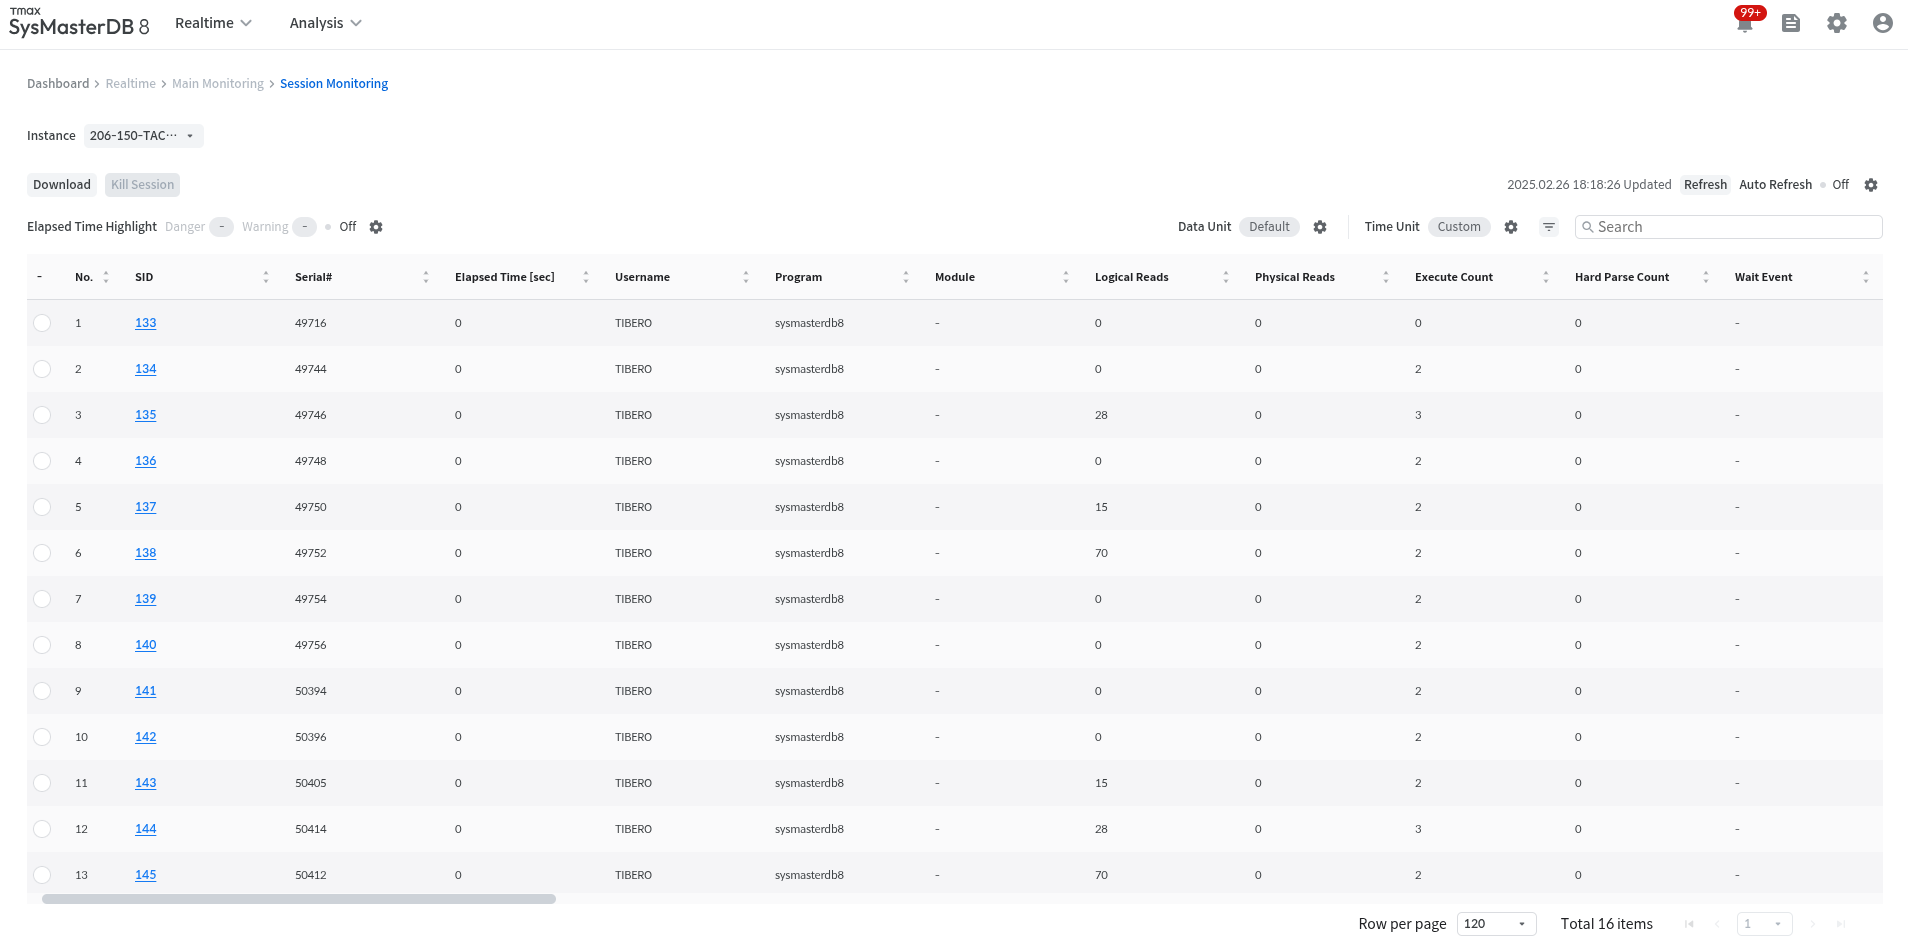
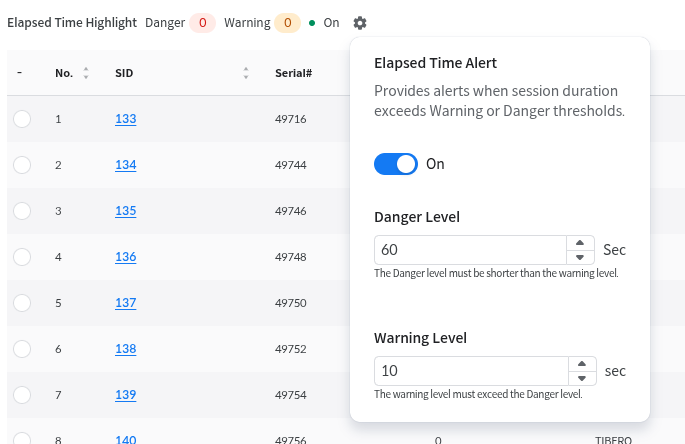
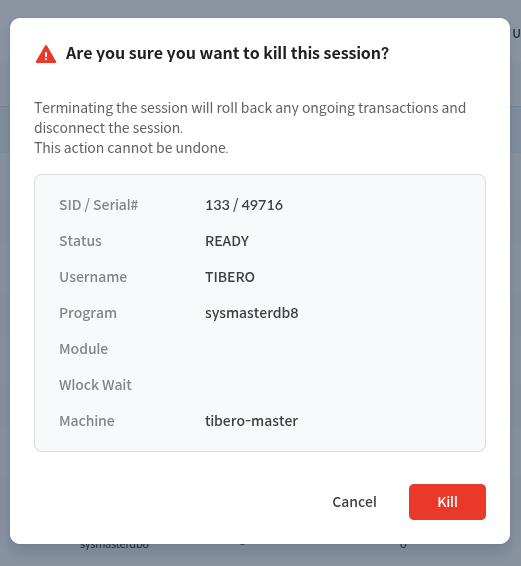
This is the process of installing SysMaster DB 8.3 in a Docker-compose and Podman-compose environment.
In the directory where the installation files are prepared, execute the following command to load the Docker/Podman image.
Docker:
Podman:
If the SKIP_V8_2_1_TO_V8_3_0_MIGRATION_PATCH parameter is set to true (comment removed), this parameter setting is ignored.
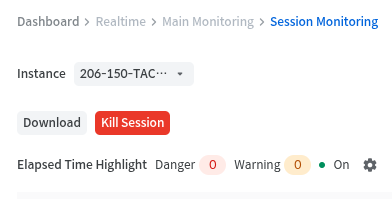
sysmaster-db-client:{version}
sysmaster-db-sdm:{version}
sysmaster-db-tibero-master:{version}
sysmaster-db-collector:{version}
sysmaster-db-analyzer:{version}
sysmaster-db-tmaxopensql-postgres:{version}
sysmaster-db-schema-registry:{version}
sysmaster-db-kafka-loggable:{version}
sysmaster-db-zookeeper-loggable:{version}
Open the docker-compose.yml file in the installation directory and define the 10 services to be created in the Docker-compose / Podman-compose environment. The description of each service is as follows.
client
The web server that users will access through their browsers
SDM
API server that retrieves collected information and communicates with clients
tibero-master
A server that performs status checks on the monitoring database and admin functions
Open the .env file in the installation directory and set the parameter values required for installing SysMaster DB 8.3.
Each parameter should be separated by a line break, and there should be no spaces between the parameter name and value; simply enter an equal sign (=).
The parameters set in this process are described as follows.
CLIENT_PORT
Port number of the UI connection URL
8
ADMIN_USERNAME
Admin account username
admin
In a rootless Podman environment, the NGINX_RESOLVER parameter must be set separately. This is necessary for reconnection when individual containers are restarted after the sysmaster is started, and it uses the gateway IP address of the sysmaster network. This value may vary depending on the environment or Podman startup.
The following example shows the process of setting NGINX_RESOLVER=10.89.0.1 and booting the sysmaster.
The users can check the Meta DB and Repository DB parameter values in the meta.conf and repo.conf files in the installation directory. These conf files use the default settings provided, but the parameters described below should be set manually by the user according to the runtime environment if necessary.
pg_max_connections
Maximum number of connections to the Meta DB (or Repository DB)
pg_owner_id
The user ID (uid) of the host OS for setting access permissions to the DB data directory. If the users want to directly access the container DB directory from a specific user on the host machine, set this to the user ID of that user.
pg_group_id
The user group ID (gid) of the host OS for setting access permissions to the DB data directory. If the users want to directly access the container DB directory from a specific user on the host machine, set this to the group ID of that user.
docker load -i sysmaster-db-{version}.tarpodman load -i sysmaster-db-{version}.tarNote
Podman-compose supports Docker-compose style yml files, so the same yml file can be used to run both Docker and Podman environments.
CLIENT_PORT=80
ADMIN_USERNAME=admin
ADMIN_PASSWORD=admin
COLLECTOR_PORT=8292
METADB_PORT=25432
METADB_USER=sysmaster
METADB_PASSWORD=sysmaster
METADB_PATH=./meta
METADB_CONF_PATH=./meta.conf
REPODB_PORT=15432
REPODB_USER=sysmaster
REPODB_PASSWORD=sysmaster
REPODB_PATH=./repo
REPODB_CONF_PATH=./repo.conf
RETENTION_DAY=7
LOG_PATH=./logs
LOG_RETENTION_DAY=1
LOG_FILE_SIZE=100MB
LOG_TOTAL_SIZE=1000MB
LOG_LEVEL=info
CONTAINER_LOG_PATH=/sysmaster/logs
KAFKA_MESSAGE_MAX_BYTES=20971520
TIME_ZONE=Asia/Seoul
SQL_FLUSH_THRESHOLD=100
SQL_RS_FETCH_SIZE=1000
# SKIP_DB_USER_COUNT_MIGRATION_PATCH=true
# SKIP_DAILY_SEGMENT_MIGRATION_PATCH=true
# SKIP_V8_2_1_TO_V8_3_0_MIGRATION_PATCH=true
# RETENTION_DAY_FOR_V8_2_1_TO_V8_3_0_MIGRATION_PATCH=7
SDM_HEAP_SIZE_MAX=
SDM_HEAP_SIZE_MIN=
ANALYZER_HEAP_SIZE_MAX=
ANALYZER_HEAP_SIZE_MIN=
COLLECTOR_HEAP_SIZE_MAX=
COLLECTOR_HEAP_SIZE_MIN=
TBM_HEAP_SIZE_MAX=
TBM_HEAP_SIZE_MIN=
PERFORMANCE_LOGGING=
LIMIT_SQL_HASH_COUNT=
# NGINX_RESOLVER=127.0.0.11 [tibero@smdb-podman ~]$ podman compose up --no-start
[tibero@smdb-podman ~]$ podman network inspect script_sysmaster
[
{
"name": "script_sysmaster",
"id": "e014d8811e9b51f417d578358ab41e2624a465d9026c7916f9ba7e4ce382f699",
"driver": "bridge",
"network_interface": "cni-podman1",
"created": "2025-08-04T22:55:11.345378476-04:00",
"subnets": [
{
"subnet": "10.89.0.0/24",
"gateway": "10.89.0.1" /// -> Use this address
}
],
"ipv6_enabled": false,
"internal": false,
"dns_enabled": true,
"labels": {
"com.docker.compose.project": "script",
"io.podman.compose.project": "script"
},
"ipam_options": {
"driver": "host-local"
}
}
]
/// Set parameters on .env file
[tibero@smdb-podman ~]$ podman compose up -dNote
The users can check the list of container images using the command
docker images | grep sysmaster .
Note
If the .env file does not exist, create it using the vim .env command.
Note
The SKIP_DB_USER_COUNT_MIGRATION_PATCH and SKIP_DAILY_SEGMENT_MIGRATION_PATCH parameters are not required for new installations and are only applicable when performing a version update in environments where SysMaster DB v8.1.2 or earlier is already installed.
If these parameters are not set separately, the patch will be automatically applied during the version update, generating DB_USER_COUNT and DAILY_SEGMENT data based on the previously collected data.
However, depending on the amount of existing data, the patch execution may take a significant amount of time. Therefore, users can optionally enable or disable the patch execution using this parameter.
Note
The SKIP_V8_2_1_TO_V8_3_0_MIGRATION_PATCH and RETENTION_DAY_FOR_V8_2_1_TO_V8_3_0_MIGRATION_PATCH parameters are not required for new installations and are only applicable when performing a version update in an environment where SysMaster DB v8.2.1 or earlier is already installed.
If these parameters are not set individually, a patch will automatically migrate data collected in versions prior to v8.2.1 to tables with the new schema applied in v8.3.0.
The list of tables with the new schema applied in v8.3.0 is as follows.
Note
If the users need to change the Meta DB and Repository DB parameters, refer to the TmaxOpenSQL User Guide for the relevant parameter settings. However, if the users modify the relevant parameters arbitrarily, normal operation of the SysMaster DB server is not guaranteed. Therefore, we recommend using the default settings for parameters other than those specified in the table above.
Especially when installing in a Podman-compose environment, setting (or changing) the pg_owner_id and pg_group_id values directly may cause abnormal operation. Podman containers operate in Rootless mode, where the root user inside the container (owner_id = 0, group_id = 0) corresponds to the host machine's user. However, since OpenSQL does not allow installation or startup in root mode, it is recommended to use the default settings.
DB_USER_COUNT data - Analysis > All Session Flow menu
DAILY_SEGMENT data - Analysis > Segment Usage menu
Therefore, if the users configure the patch to be omitted (set each parameter to true and remove comments), the data from the past (collected before the update) will not be displayed in the menus 1 and 2 above. Therefore, we recommend that the users do not configure these parameters separately by default.
However, in the following cases, users can set the relevant parameters to true (remove comments) to skip the patch described earlier.
When viewing past data (collected in SysMaster DB v8.1.2 or earlier) in the menus mentioned in steps 1 and 2 is unnecessary
If there is concern that the SysMaster DB server resources may be insufficient during the data creation patch process, resulting in prolonged unavailability of the SysMaster DB, and this must be prevented.
Users can selectively set only the desired parameter among the two parameters as needed.
SQL
SQL_TEXT
SQL_PLAN
DB_SESSION
SESSION_TEMP
SESSION_UNDO
LOCK
SQL_TRACE
The migration process for the above tables may take a long time depending on the amount of data collected.
Users can optionally enable or disable the execution of the patch by configuring the following parameters as needed.
SKIP_V8_2_1_TO_V8_3_0_MIGRATION_PATCH
Set whether to perform the patch that migrates data from versions prior to v8.2.1 to the new schema applied in v8.3.0 for tables with the new schema.
If the SKIP_V8_2_1_TO_V8_3_0_MIGRATION_PATCH parameter is set to true (comment removed), migration will not be performed on all tables targeted by the patch.
If migration is not performed using the SKIP_V8_2_1_TO_V8_3_0_MIGRATION_PATCH setting, data collected in v8.2.1 or earlier will be deleted and will no longer be available for retrieval.
Therefore, it is recommended not to set this parameter separately by default.
However, in the following cases, users may consider skipping the migration:
If there is no need to view past data (collected in SysMaster DB v8.2.1 or earlier) from tables subject to the new schema in v8.3.0
If there are concerns that the SysMaster DB server resources may be insufficient during the data creation patch process, resulting in prolonged unavailability of the SysMaster DB, and this must be prevented.
In such cases, users can set the following parameter to perform the migration patch while separately specifying the data scope (daily period) for the patch execution.
RETENTION_DAY_FOR_V8_2_1_TO_V8_3_0_MIGRATION_PATCH
Set the migration target data range (daily period) for data collected prior to v8.2.1 in tables where the new schema has been applied in v8.3.0.
For example, if the RETENTION_DAY_FOR_V8_2_1_TO_V8_3_0_MIGRATION_PATCH parameter is set to 7 (comment removed), migration will only be performed on data collected in v8.2.1 or earlier within the last 7 days.
If the SKIP_V8_2_1_TO_V8_3_0_MIGRATION_PATCH parameter is set to true (comment removed), this parameter setting is ignored.
Refer to the above explanation to select and apply appropriate parameter settings for the usersr operating environment.
collector
A server that collects data from the monitoring database
analyzer
A server that processes, analyzes, and stores collected information
metadb
DB server that stores UI-related setting information
repodb
A DB server that stores monitoring database collection data
zookeeper
Manages the status of Kafka Broker servers
broker
Kafka Broker server
Schema Registry
Kafka message protocol management
ADMIN_PASSWORD
Password for the Admin account
admin
COLLECTOR_PORT
Port number for the collection module (TPM Agent) to connect to [Note] Must be open on the SysMaster server to allow access from the monitoring DB
829
METADB_PORT
Meta DB connection port number
25432
METADB_USER
Meta DB super user name
sysmaster
METADB_PASSWORD
Meta DB super user password
sysmaster
METADB_PATH
Meta DB data file path
./meta
METADB_CONF_PATH
Path to the Meta DB configuration file
./meta.conf
REPODB_PORT
The port number for connecting to the repository DB
15432
REPODB_USER
Super user name for the repository DB
sysmaster
REPODB_PASSWORD
Repository DB super user password
sysmaster
REPODB_PATH
Repository DB data file path
./repo
REPODB_CONF_PATH
Path to the repository DB configuration file
./repo.conf
RETENTION_DAY
Retention period for collected information
7
LOG_PATH
Log creation location
./logs
LOG_RETENTION_DAY
Log file retention period
1
LOG_FILE_SIZE
Maximum size of a single log file
100MB
LOG_TOTAL_SIZE
Maximum log storage capacity per module
1000MB
LOG_LEVEL
Log level for each module
info
CONTAINER_LOG_PATH
Set the container internal log path
/sysmaster/logs
KAFKA_MESSAGE_MAX_BYTES
Set the Kafka message size, Can be set within the range of 1MB to 2GB
20971520 bytes
TIME_ZONE
SysMaster DB server time zone setting
Asia/Seoul
SQL_FLUSH_THRESHOLD
Limits the number of pieces of information that can be contained in a single SQL-related message. For SQL Plans, this value is limited to 10 times the specified value.
100 per monitoring DB
SQL_RS_FETCH_SIZE
The number of SQL-related information rows retrieved from the monitoring DB at one time.
1,000 per monitoring database
SKIP_DB_USER_COUNT_MIGRATION_PATCH
(When applying patches to an existing environment,) whether to skip the patch that creates the DB_USER_COUNT table data in the Repository DB based on previously collected data. If necessary, refer to [Note 1] below and configure accordingly.
true (disabled via comment)
SKIP_DAILY_SEGMENT_MIGRATION_PATCH
(When applying patches to an existing environment,) whether to skip the patch that creates data in the DAILY_SEGMENT table of the Repository DB based on existing data. If necessary, refer to [Reference 1] below and configure accordingly.
true (disabled via comment)
SKIP_V8_2_1_TO_V8_3_0_MIGRATION_PATCH
(When applying the patch to an existing environment,) whether to skip the migration of existing data collected in v8.2.1 or earlier for tables targeted by the new schema in v8.3.0. If necessary, refer to [Reference 2] below and configure accordingly.
true (disabled via comment)
RETENTION_DAY_FOR_V8_2_1_TO_V8_3_0_MIGRATION_PATCH
(When applying patches to an existing environment,) the migration scope (daily period) for data collected in v8.2.1 or earlier that is subject to migration in tables where the new schema has been applied in v8.3.0. If necessary, refer to [Note 2] below and configure accordingly.
7 (Not applied via comment)
SDM_HEAP_SIZE_MAX
Maximum heap size for SDM
1/4 of the total memory of the current container (refer to the "total mem" output of the "free" command). [Note] The current default Docker image is openjdk:17-alpine.
SDM_HEAP_SIZE_MIN
Minimum heap size for SDM
It is 1/64 of the total memory of the current container (refer to the total mem of the free command). [Note] The current default Docker image is openjdk:17-alpine.
ANALYZER_HEAP_SIZE_MAX
Maximum heap size for the analyzer
1/4 of the current container's total memory (refer to the total mem value from the free command). [Note] The current default Docker image is openjdk:17-alpine.
ANALYZER_HEAP_SIZE_MIN
Analyzer's minimum heap size
1/64 of the current container's total memory (refer to the total mem value from the free command). [Note] The current default Docker image is openjdk:17-alpine.
COLLECTOR_HEAP_SIZE_MAX
Maximum heap size for the collector
1/4 of the current container's total memory (refer to the total mem value from the free command). [Note] The current default Docker image is openjdk:17-alpine.
COLLECTOR_HEAP_SIZE_MIN
Minimum heap size for the collector
1/64 of the current container's total memory (refer to the total mem value from the free command). [Note] The current default Docker image is openjdk:17-alpine.
TBM_HEAP_SIZE_MAX
Maximum heap size for TBM
1/4 of the current container's total memory (refer to the total mem value from the free command). [Note] The current default Docker image is openjdk:17-alpine.
TBM_HEAP_SIZE_MIN
Minimum heap size for TBM
It is 1/64 of the current container's total memory (refer to the total mem value from the free command). [Note] The current default Docker image is openjdk:17-alpine.
PERFORMANCE_LOGGING
Whether to enable performance-related logging [Note] Since this uses additional CPU and disk resources, setting this to Y may cause performance degradation.
N
LIMIT_SQL_HASH_COUNT
The maximum number of SQL plan hash value + cost combinations stored in memory to prevent duplicate collection, and the maximum number of SQL text hash values at the same time.
1 million [Note] This occupies approximately 300MB of memory in total.
NGINX_RESOLVER
Podman environment-specific setting Specifies the gateway address of the Sysmaster internal DNS network for DNS name resolution in NGINX. This setting is only required in the Podman environment and does not require additional configuration in other runtimes such as Docker.
Can be verified using `podman network inspect script_sysmaster`.
log_timezone
Time zone for logs in the Meta DB (or Repository DB).
The Performance Trend provides a macro-level view of changes in each indicator through the Overall chart and allows the users to check session and SQL indicators down to the second at the time of the problem using time slices. This enables the users to identify the time of the problem and its cause in one go. When the users first enter the Performance Trend menu, the users can view the Overall chart. The users can check the trends for each instance by time interval, including CPU, Memory, Session, and Wait Class.
The Overall chart in Performance Trend shows the trend and summary information of CPU, Memory, Running Session, and Wait Class values during the query period. It provides detailed analysis by time and date, and the users can select the chart interval and aggregation method from the drop-down menu for each graph. Additionally, the users can view the value of the indicator by hovering the mouse over it.
Clicking on a chart will take the users to the Time Slice page for the 1-hour range at that point in time, enabling more detailed analysis.
Displays the trend of CPU usage changes during the specified time interval.
Displays the trend of memory usage during the selected analysis period.
The users can check the trend of the Running Session Count during the selected analysis period.
The users can view the trend of Wait Class Time that occurred during the selected analysis period.
The Performance Chart is a screen that displays the Performance Trend for a specified time period, enabling detailed analysis of CPU, Memory, Session, and Wait Class metrics.
The upper and middle charts show session indicators by category, DB performance statistics, memory usage, percentage distribution by Wait Class, Time/Count indicators for major Wait Events, and hourly changes in the time consumed by each Wait Class.
Clicking the top chart displays a second-level chart in the middle. Clicking the second-level chart and selecting a category allows the users to view session-related metrics, SQL execution-related metrics, lock-related metrics, and wait event-related metrics at that specific point in time.
The following is a description of the charts provided at the top of the Performance Chart screen.
Provides information about running sessions by time interval in a bar chart. The users can select the desired metric by choosing the legend in the top-right corner. Additionally, the users can select the aggregation method (MIN, MAX, AVG) using the combo box.
Provides information for each metric (Logical Reads, Physical Reads, Redo Entries, etc.) by time interval in a bar chart. The users can select the desired metric by choosing the legend in the upper-right corner. Additionally, the users can select the aggregation method (MIN, MAX, AVG) using the combo box.
Provides CPU usage rate information by time interval. The users can select the desired CPU usage rate metric by choosing the legend in the top-right corner. Additionally, the users can select the MIN, MAX, or AVG aggregation method using the combo box.
Provides memory usage information by time interval. The users can select the desired metrics by choosing the legend in the upper-right corner. Additionally, the users can select the aggregation method (MIN, MAX, AVG) using the combo box.
Displays the same data in a more intuitive format as a percentage (%) based on the Wait Class. The users can select the desired metric by choosing the legend in the upper-right corner. Additionally, the users can select the aggregation method (MIN, MAX, AVG) using the combo box.
Provides bar chart information on major wait events by time interval. The users can check how many seconds the event occurred during that time. The users can select the desired indicator by selecting the legend at the top right. The users can also select the MIN, MAX, or AVG aggregation method using the combo box.
Provides time-based information on major wait events in a bar chart. The users can see how many times a wait event occurred at a specific time. The users can select the desired metric by choosing the legend in the top-right corner. Additionally, the users can select the aggregation method (MIN, MAX, AVG) using the combo box.
Provides classified information about Wait Events in a Stacked Bar Chart format. The users can select the desired metric by choosing the legend in the top-right corner. Additionally, the users can select the aggregation method (MIN, MAX, AVG) using the combo box.
The following is an explanation of the table categories provided at the bottom when the users click on the Performance Chart.
The Snapshot area of the Performance Chart provides a summary of Wait Class information for Running Sessions at the specified time point, as well as SQL execution history for each session and other session information for the specified interval.
The Top Process category aggregates process information with high CPU and memory resource usage at the OS level for each time interval and displays the resources used by each process.
In the Session area of the Performance Chart, clicking the graph at the top displays a list of Running Sessions for the corresponding time interval.
In the SQL area of the Performance Chart, clicking the graph at the top displays a list of SQL statements executed in each session during the specified time interval. Clicking an SQL ID takes the users to the SQL Detail page for that SQL statement.
The All SQL area of the Performance Chart displays a list of all SQL statements executed during the time period when the graph at the top is clicked.
In the Lock Tree area of the Performance Chart, clicking the graph at the top displays the wait situations caused by transaction locks between sessions during that interval in a tree format.
In the Wait Detail area of the Performance Chart, clicking the graph at the top displays the Wait Events that occurred during the past minute, and clicking a specific Wait Event displays a list of sessions where the Wait Event occurred on the right.
User Name
Current user name
Program
The name of the program in the session
Module
The name of the module specified by dbms_application_info.set_module
Logical Reads
The Logical Reads value of the session
Physical Reads
The Physical Reads value of the session
Execute Counts
Execute Count value for the session
Redo Entries
Redo Entries value for the session
Hard Parse
Hard Parse value for the session
Wait Event
The type of Wait Event that the session is waiting for
Wait Time
The time the session has been waiting for the Wait Event
Status
The status of the session -READY: Session ready state -RUNNING: Session is running -TX_RECOVERING: Transaction recovery in progress -SESS_CLEANUP: Session resources are being cleaned up -ASSIGNED: Thread assigned to session but not yet ready - CLOSING: Session closed -ROLLING_BACK: Slave of PE specification level transaction rolled back
State
State of the work thread -INVALID: Not initialized -NEW: Being created -IDLE: Ready to execute -RUNNING: Running -WAITING: Waiting for internal message -RECV_WAITING: Waiting for client message -STOP_BY_MTHR: Stopped by the monitoring process -DEAD: Dead state
PGA Memory (Session)
PGA memory usage of the session
SQL Trace
Whether to use SQL tracing in the session
Wlock Wait
Wait type that the session is waiting for
Audsid
Second serial number of the session
User ID
User ID information
IP Address
User connection IP address
TX_UNDO_BLK_CNT
Number of transaction undo blocks
TX_UNDO_REC_CNT
Number of transaction undo records
Command
Current SQL type being executed -0: No SQL being executed -1: SELECT -2: INSERT -3: UPDATE -4: DELETE -5: MERGE -6: CALL
Schema
Session Schema
Thr Type
Session type -WTHR: Working thread -CTHR: Control thread -LGWR: Log writing process -CKPT: Checkpoint process -LARC: Log archive -AGENT: Sequence process -MTHR: Monitoring process -DBWR: Datablock writing process -LNW: Log network writing process
SQL ID
SQL ID of the SQL being executed by the session
Child Number
Child Number value of the SQL ID being executed by the session
Prev SQL ID
SQL ID of the last SQL executed
Prev Child Number
Child Number value of the last executed SQL ID
Logon Time
The logon time of the session
Client PID
Client PID of the session
PID
The identifier of the process to which the session belongs
OS User
OS account name of the connected session
Machine
Host name of the connected session
Terminal
Terminal (TTY) information for the connected session
Action
Name of the action specified by dbms_application_info.set_module/action
Client Info
The name of the client_info specified by dbms_application_info.set_client_info
Client Identifier
Name of the client ID specified by dbms_session.set_identifier
Backup Wait
The time waited for Backup Wait
DD Wait
The time waited for DD Wait
DDL Wait
Time spent waiting for DDL Wait
Internal Wait
Time spent waiting for Internal Wait
IO Wait
Time spent waiting for IO Wait
PSM Wait
Time spent waiting for PSM Wait
Recovery Tac Wait
Time spent waiting for Recovery Tac Wait
Recovery Wait
Time spent waiting in Recovery Wait
Redo Tac Wait
Time spent waiting for Redo Tac Wait
Redo Wait
Time spent waiting for Redo Wait
Resource Wait
Time spent waiting for Resource Wait
Session Wait
Time spent waiting for Session Wait
Space Wait
Time spent waiting for space
Sql Tac Wait
Time spent waiting for Sql Tac Wait
Standby Wait
Time spent waiting in Standby Wait
Wlock Wait
Time spent waiting for Wlock Wait
Xa Wait
Time spent waiting for Xa Wait
CPU (%)
CPU usage at the process level
Memory
Memory usage
Running Time
Process running time
Last time
Last time of the process
Logon Time
Logon time of the session
Elapsed Time
Elapsed time of the SQL currently being executed in the session
Machine
Host name of the connected session
Program
The program name of the session
Module
The name of the module specified by dbms_application_info.set_module
Action
The name of the action specified by dbms_application_info.set_module/action
OS User
The OS account name of the connected session
IP Address
User connection IP address
CPU Time
CPU usage time of the session
Logical Reads
Logical Reads value for the session
Physical Reads
Physical Reads value for the session
Execute Counts
Execute Count value for the session
Redo Entries
Redo Entries value for the session
Hard Parse
Hard Parse value for the session
Backup Wait
Time spent waiting for Backup Wait
DD Wait
Time waited for DD Wait
DDL Wait
Time spent waiting for DDL Wait
Internal Wait
Time spent waiting for Internal Wait
IO Wait
Time spent waiting for IO Wait
PSM Wait
Time spent waiting for PSM Wait
Recovery Tac Wait
Time spent waiting for Recovery Tac Wait
Recovery Wait
Time spent waiting in Recovery Wait
Redo Tac Wait
Time spent waiting for Redo Tac Wait
Redo Wait
Time spent waiting for Redo Wait
Resource Wait
Time spent waiting for Resource Wait
Session Wait
Time spent waiting for Session Wait
Space Wait
Time spent waiting for space
Sql Tac Wait
Time spent waiting for Sql Tac Wait
Standby Wait
Time spent waiting in Standby Wait
Wlock Wait
Time spent waiting for Wlock Wait
Xa Wait
Time spent waiting for Xa Wait
Elapsed Time
Elapsed time of the SQL currently being executed
Execute Counts
Number of times the SQL was executed
CPU Time
CPU usage time
Logical Reads
Number of blocks read by memory I/O
Physical Reads
Number of blocks read via block I/O
Redo Entries
Number of redo entries
Hard Parse
Hard Parse value of SQL
Application Wait
Time spent waiting for Application Wait
Cache Wait
Time spent waiting for Cache Wait
Cluster Wait
Time spent waiting for Cluster Wait
Concurrency Wait
Time spent waiting for concurrency
Other Wait
Time spent waiting for Other Wait
SQL Wait
Time spent waiting for SQL Wait
System IO Wait
Time spent waiting for System I/O Wait
User IO Wait
Time spent waiting for User I/O
SQL ID
SQL ID of the SQL being executed by the session
Child Number
Child number of the SQL being executed by the session
SQL Text
SQL content
Elapsed Time
Elapsed time of the SQL currently being executed
Start Time
Start time of the SQL
End Time
The end time of the SQL
Log Time
The time when the SQL execution was recorded in the system master
Machine
Host name of the connected session
Module
The name of the module specified by dbms_application_info.set_module
Program
The name of the program for the session
User Name
Current user name
OS User
OS account name of the connected session
CPU Time
CPU usage time of the session
Logical Reads
Logical Reads value of the session
Physical Reads
Physical Reads value for the session
Execute Counts
Execute Count value for the session
Redo Entries
Redo Entries value for the session
Hard Parse
Hard Parse value for the session
Backup Wait
Time spent waiting for Backup Wait
DD Wait
Time waited for DD Wait
DDL Wait
Time spent waiting for DDL Wait
Internal Wait
Time spent waiting for Internal Wait
IO Wait
Time spent waiting for IO Wait
PSM Wait
Time spent waiting for PSM Wait
Recovery Tac Wait
Time spent waiting for Recovery Tac Wait
Recovery Wait
Time spent waiting in Recovery Wait
Redo Tac Wait
Time spent waiting for Redo Tac Wait
Redo Wait
Time spent waiting for Redo Wait
Resource Wait
Time spent waiting for Resource Wait
Session Wait
Time spent waiting for Session Wait
Space Wait
Time spent waiting for space
Sql Tac Wait
Time spent waiting for Sql Tac Wait
Standby Wait
Time spent waiting in Standby Wait
Wlock Wait
Time spent waiting for Wlock Wait
Xa Wait
Time spent waiting for Xa Wait
Elapsed Time
Running time of the session
Status
Session holder and waiter information
Session Status
Session status
Wait Time
Time waited
User Name
Session user name
Module
Session module name
Program
Session program name
Machine
Host name of the session
IP Addr
User IP address of the connection
SQL ID
SQL ID of the SQL being executed by the session
Child Number
Child Number value of the SQL Plan being executed by the session
Wait Event
The name of the wait event for the session
Type
Lock type
ID1
Lock ID1
ID2
Lock ID2
Mode
Lock mode held by the holder (Waiter is always 0)
Request
Lock mode requested by the Waiter (Holder is always 0)
Count
Number of wait events
Time
Wait Event Wait Time
Count
Number of wait events
User Name
Current user name
Module
Name of the module specified by dbms_application_info.set_module
OS User
The OS account name of the connected session
Machine
The host name of the connected session
Program
The program name of the session
SID
Session ID
Serial #
Serial number of the session
Elapsed Time
Elapsed time of the SQL currently being executed in the session
PID
The OS PID value of the process
Command
The OS command of the process
User
OS user name
SID
Session ID
Serial #
Serial number of the session
User Name
Current user name
SQL ID
SQL ID of the SQL currently being executed
Child Number
Child Number value of the SQL being executed
SQL Text
SQL content
SQL ID | Child Number
Pairs of SQL ID and Child Number values for SQL statements being executed by the session
SID
The ID of the session
Serial #
The serial number of the session
Instance
Database instance number
SID
Session SID
Serial #
Session serial number
Name
Wait Event name
Desc
Wait Event Details
Wait Class
Wait Class Name
SID
Session ID
Serial #
Serial number of the session
Time
Wait Event Wait time
Note
Wait Class is a classification of each Wait Event that occurs during a task in Tibero. For example, in the case of IO Class, it aggregates the time consumed and the number of occurrences of Wait Events that occurred during IO-related tasks.
Caution
Some metrics (such as Username, Program, Module, Schema, OS User, Machine, Terminal, etc.) may not be collected depending on the version of the Tibero library used for session information collection.
Note
Difference between Snapshot and Session:
Snapshot: A category for checking the state changes of each session every second.
Session: A category for viewing overall metrics of a session over a period of one minute or longer.
Note
Session is an indicator that shows the overall metrics of the Session during the specified time interval.
For Sessions, the users can understand the overall metrics of the Session during the specified time interval.