> For the complete documentation index, see [llms.txt](https://docs.tibero.com/sysmasterdb/llms.txt). Markdown versions of documentation pages are available by appending `.md` to page URLs; this page is available as [Markdown](https://docs.tibero.com/sysmasterdb/8.4_manual/detail/session-detail/session-info.md).

# Session Info 탭

현재 session의 상태 정보, session에서 수행 중인 SQL 정보들을 보여준다.

### Wait event 정보

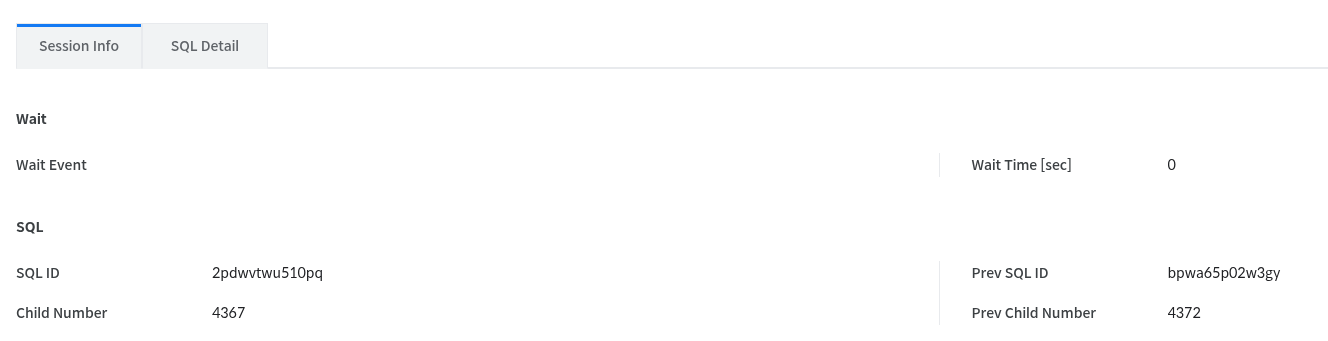
현재 session의 wait event 발생 정보이다.

<figure><img src="https://content.gitbook.com/content/gw24XwSa6QXLFywb7Txd/blobs/68nnK6zej8Lm9lNKa9US/image.png" alt=""><figcaption></figcaption></figure>

| 항목         | 설명                                  |
| ---------- | ----------------------------------- |
| Wait Event | 현재 session에서 발생한 wait event 이름      |
| Wait Time  | 현재 session에서 발생한 wait event로 대기한 시간 |

***

### Session이 수행한 SQL 기본 정보

| 항목                | 설명                               |
| ----------------- | -------------------------------- |
| SQL ID            | 세션이 수행 중인 SQL의 SQL ID            |
| Prev Child Number | 세션이 이전에 수행했던 SQL의 Child Number 값 |
| Child Number      | 세션이 수행 중인 SQL의 Child Number 값    |
| Prev SQL ID       | 세션이 이전에 수행했던 SQL의 SQL ID         |

***

### SQL Full Text

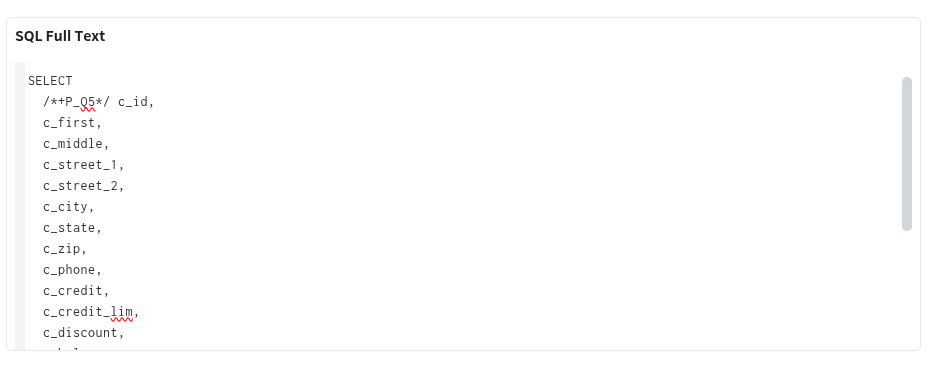
현재 session에서 수행 중인 SQL 전문을 보여준다.

<figure><img src="https://content.gitbook.com/content/gw24XwSa6QXLFywb7Txd/blobs/MANSEvV0BHjBHuEC4TiZ/image.png" alt=""><figcaption></figcaption></figure>

***

### Plan Tree

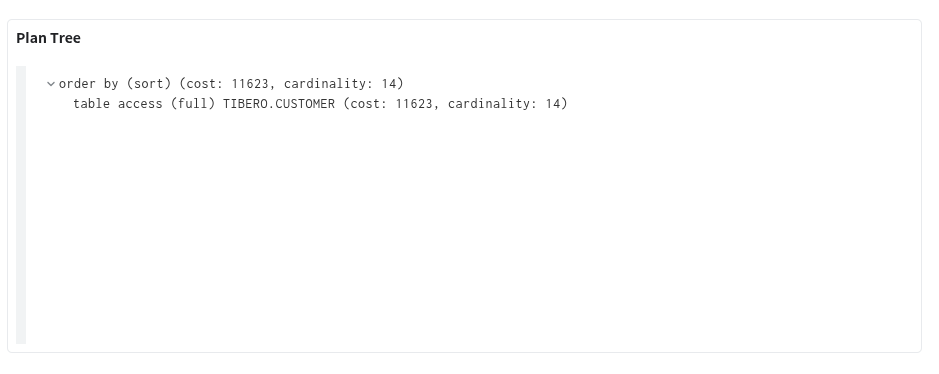
현재 session에서 수행 중인 SQL에 대한 Plan을 확인할 수 있는 화면이다. 이때 SQL Plan을 Tree 구조로 보여준다.

<figure><img src="https://content.gitbook.com/content/gw24XwSa6QXLFywb7Txd/blobs/cvV0UMiYNyx9K8nEqfQ2/image.png" alt=""><figcaption></figcaption></figure>

***

### Statistics

현재 session 상태 지표이다.

<figure><img src="https://264733866-files.gitbook.io/~/files/v0/b/gitbook-x-prod.appspot.com/o/spaces%2Fgw24XwSa6QXLFywb7Txd%2Fuploads%2FKxt5KIV8N2W8Sl4W3Xe2%2F273_session-statistics.png?alt=media" alt=""><figcaption></figcaption></figure>

상태 지표 별 항목은 다음과 같다.

| 항목        | 설명                                                                          |
| --------- | --------------------------------------------------------------------------- |
| Σ         | 진입할 때의 조회 기준 시점 1시간 전부터 조회 시점까지 세션이 누적한 지표별 값. Refresh해도 누적 시작 시각은 바뀌지 않는다. |
| Delta     | 직전 조회 대비 Σ의 변화량. 처음 조회했을 때는 Delta와 Value/Sec가 -로 표시된다.                      |
| Value/Sec | Delta 값을 직전 조회와의 시간 간격(초)으로 나누어 계산한 값                                       |

상태 지표 목록은 다음과 같다. 화면에는 지표 이름 뒤에 단위가 함께 표시된다(예: Block Disk Read \[Block]).

| Statistics 지표 이름                     | 설명                                                                                                               |
| ------------------------------------ | ---------------------------------------------------------------------------------------------------------------- |
| Block Disk Read                      | 디스크에서 Block을 한 개씩(Single Block Read) 읽은 Block 개수                                                                 |
| Multi Block Disk Read                | 디스크에서 Multi Block Read로 읽은 Block 개수                                                                              |
| Consistent Multi Block Gets          | Multi Block 단위의 Consistent Read로 읽은 Block 개수                                                                     |
| Consistent Block Gets                | Consistent Read (CR) mode로 읽은 Block 개수                                                                           |
| Consistent Block Gets Readonly Pin   | Readonly block에 대해 consistent block get을 수행한 횟수                                                                  |
| Consistent Block Gets Examine        | Index block unique key search 등에서 Pin을 잡지 않고 필요한 값을 빠르게 얻어오는 Consistent Read(CR) examine 기능을 사용한 횟수              |
| Consistent Block Gets Examine Nowait | Consistent Read Mode examine에 대한 nowait의 횟수                                                                      |
| Current Block Gets                   | <p>Current 상태에 있는 Block의 데이터를 읽은 횟수</p><p>(current block gets : 최신 버전의 Block을 버퍼 Cache에서 찾아 pin하는 것과 관련된 수치)</p> |
| Current Block Gets Nowait            | current block gets에 대한 nowait 수행 횟수 (대기 없이 current block get을 수행한 횟수)                                            |
| Current Block Gets Examine           | Index branch peep이나 데이터 Block의 Rowlock 정보를 Block pin없이 빠르게 얻어오는 Current examine 기능의 사용 횟수                        |
| Current Block Gets Examine Nowait    | current block gets examine에 대한 nowait 횟수                                                                         |
| Total Parse Count                    | Parse 총 횟수                                                                                                       |
| Hard Parse Count                     | Hard Parse 횟수                                                                                                    |
| Redo Entries                         | <p>Redo Entries의 개수</p><p>(Redo Entries : 세션이 Log Buffer에 기록한 Redo 레코드)</p>                                      |
| Redo Log Size                        | Redo 로그 사이즈                                                                                                      |
| Redo Write                           | Redo 버퍼의 로그 Block들을 디스크에 기록한 횟수                                                                                  |
| Redo Write Multi                     | Redo 로그 버퍼의 내용 기록을 요청한 세션이 다수인 경우의 횟수                                                                            |
| Physical Write                       | 디스크에 write한 Block 개수                                                                                             |
| Req Service Time                     | DB Time (실제 Working 스레드가 일한 시간의 총합)                                                                              |
| DB CPU Time                          | CPU 사용 시간                                                                                                        |
| User Commit                          | 세션의 User Commit 횟수                                                                                               |
| User Rollbacks                       | 사용자가 롤백을 요청한 횟수                                                                                                  |
| Execute Count                        | SQL 실행 횟수                                                                                                        |
| Physical Reads                       | Disk I/O로 읽은 Block 개수                                                                                            |
| Logical Reads                        | Memory I/O로 읽은 Block 개수                                                                                          |