> For the complete documentation index, see [llms.txt](https://docs.tibero.com/sysmasterdb/llms.txt). Markdown versions of documentation pages are available by appending `.md` to page URLs; this page is available as [Markdown](https://docs.tibero.com/sysmasterdb/8.4_manual/analysis/history-analysis/all-session-flow.md).
# All Session Flow
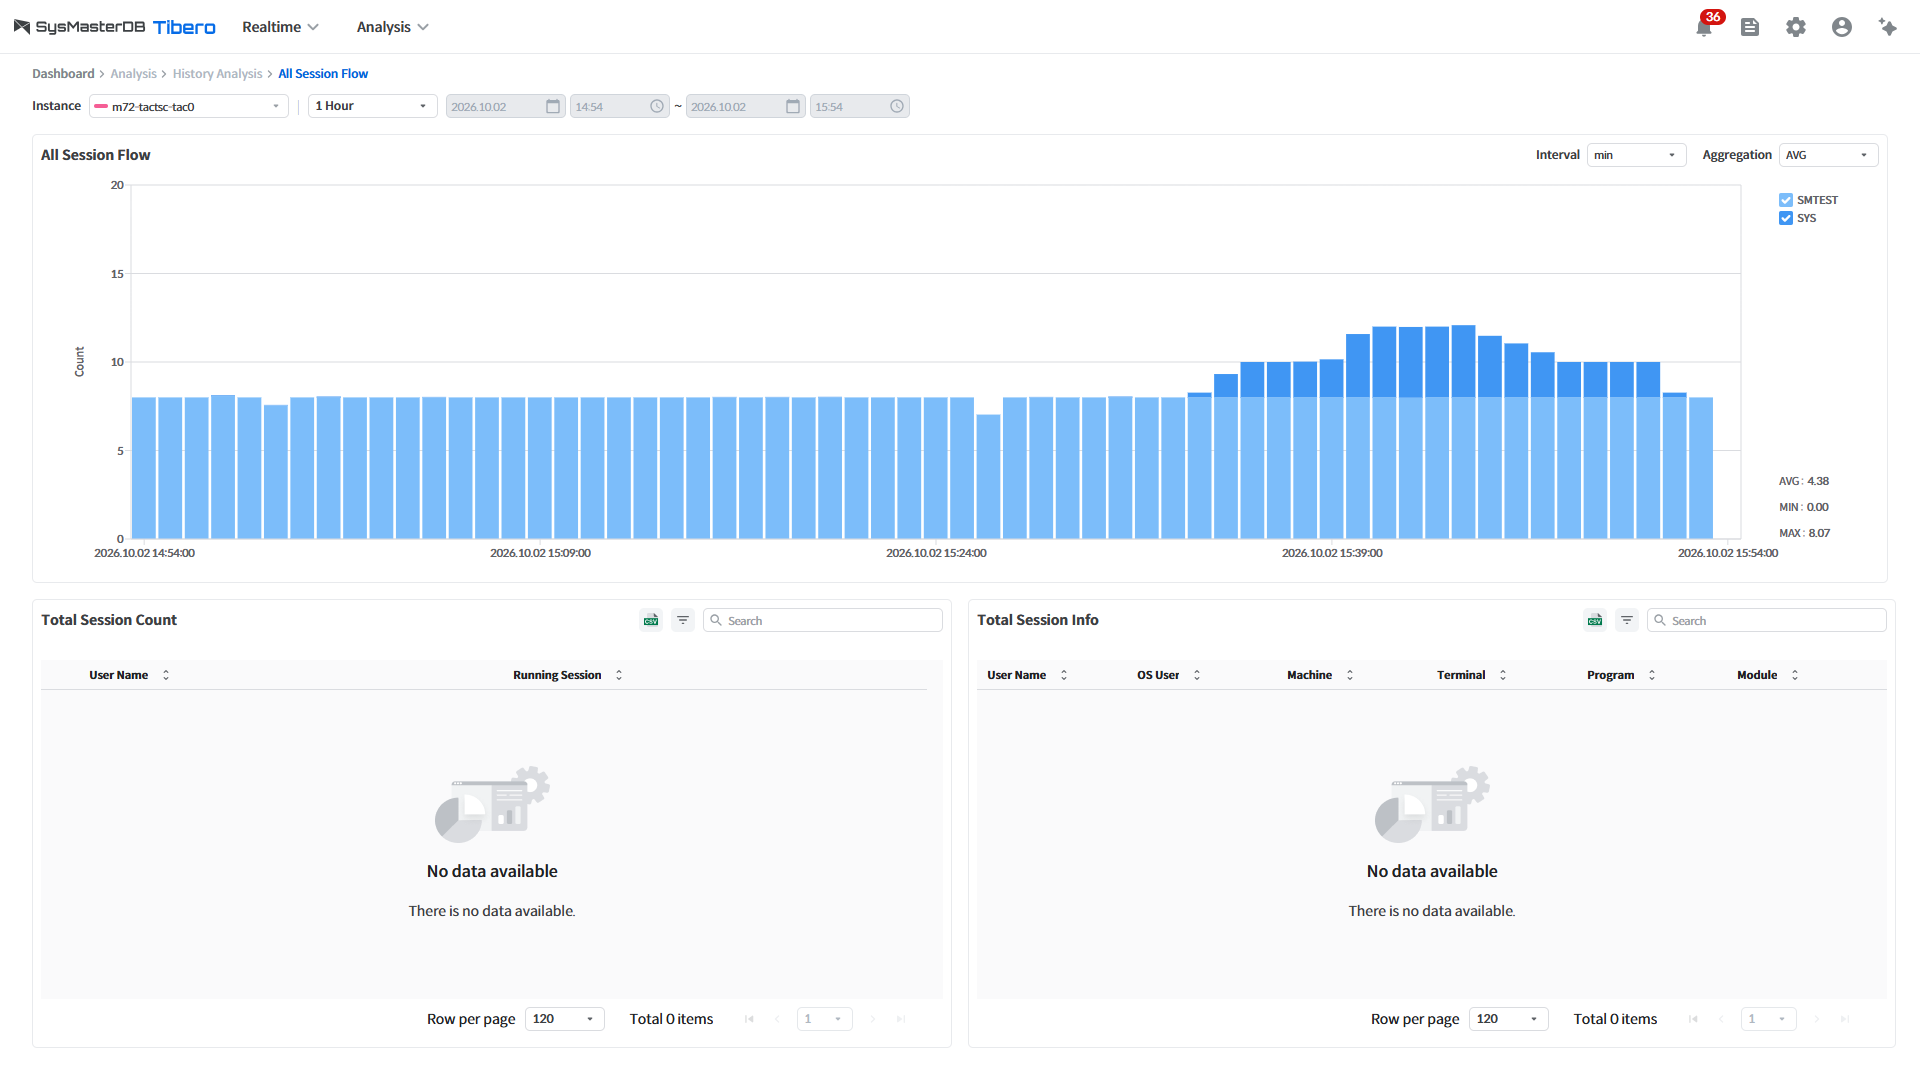
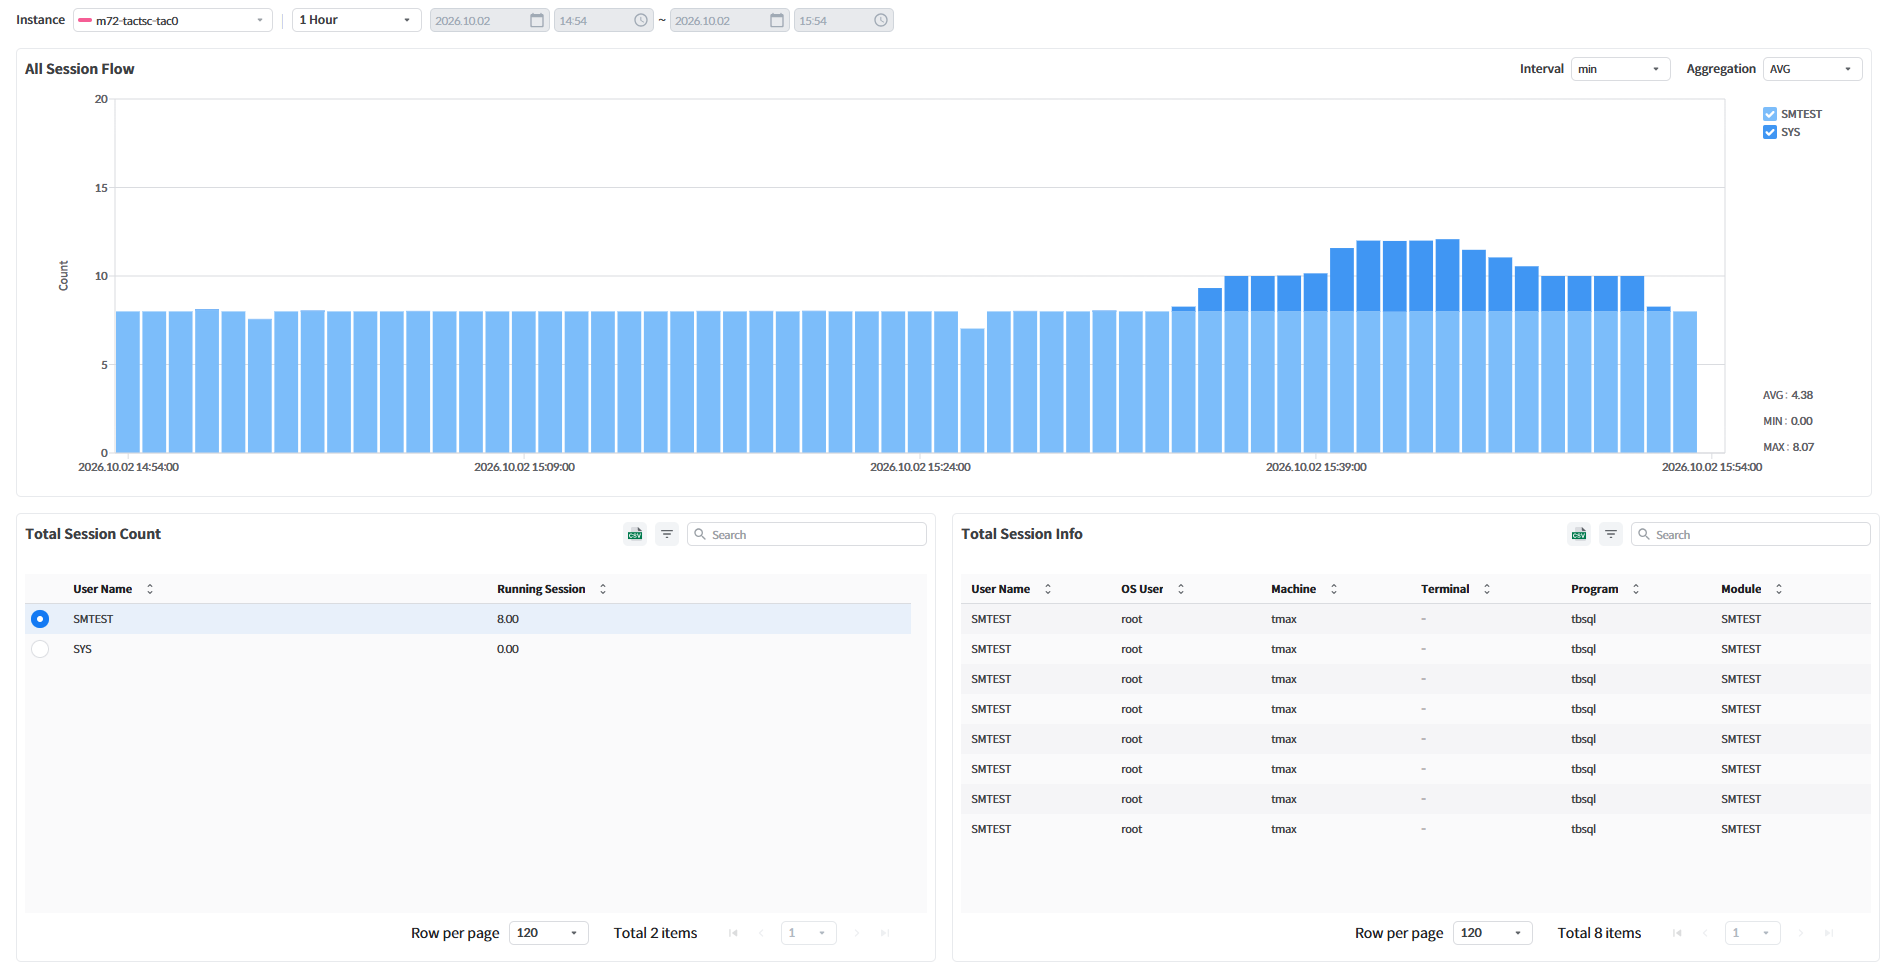
글로벌 내비게이션 바에서 **\[Analysis] > \[History Analysis] > \[All Session Flow]** 메뉴를 클릭하면 All Session Flow 화면이 열린다.
All Session Flow 화면에서는 지정한 기간 동안 접속한 DB 사용자별로 구분하여 세션 개수를 그래프로 제공한다. 이때 특정 시점에 사용자별로 Running 상태인 세션이 몇 개였는지 확인할 수 있으며, 선택한 시점에 어떤 세션들이 활동을 하였는지 확인할 수 있다.
### Chart Interval
All Session Flow 차트 제목 오른쪽에서 Chart Interval과 Aggregation을 직접 선택할 수 있다. 기본값은 min, AVG이며, Interval이 sec이면 Aggregation은 선택할 수 없다. 기본 조회 기간은 1 Hour이다.
Chart Interval
Chart Interval은 sec, min, hour, day 중에서 선택하며, 선택한 Period의 길이에 따라 고를 수 있는 항목이 달라진다. 노출 조건은 [Period Selector](/sysmasterdb/8.4_manual/common-ui/period-selector.md)의 Interval 규칙과 같다(sec 1시간 이하, min 24시간 이하, hour 2시간 이상, day 48시간 이상).
자세한 내용은 하위 페이지에서 설명한다.
{% content-ref url="/pages/MBIw4mZRDa3sejStuL2A" %}
[All Session Flow](/sysmasterdb/8.4_manual/analysis/history-analysis/all-session-flow/all-session-flow.md)
{% endcontent-ref %}
{% content-ref url="/pages/kna0HVhkUbd7sPgP5atV" %}
[Total Session Count](/sysmasterdb/8.4_manual/analysis/history-analysis/all-session-flow/total-session-count.md)
{% endcontent-ref %}
{% content-ref url="/pages/MNmGQ7MQYyGX0EAKtffu" %}
[Total Session Info](/sysmasterdb/8.4_manual/analysis/history-analysis/all-session-flow/total-session-info.md)
{% endcontent-ref %}