> For the complete documentation index, see [llms.txt](https://docs.tibero.com/sysmasterdb/llms.txt). Markdown versions of documentation pages are available by appending `.md` to page URLs; this page is available as [Markdown](https://docs.tibero.com/sysmasterdb/8.3_manual/analysis/performance-analysis/performance-trend.md).

# Performance Trend

Performance Trend에서는 Overall 차트를 통해 각 지표의 변화 추이를 거시적 시점에서 확인하는 기능과 타임 슬라이스를 사용해 문제가 되는 시점의 초단위까지 세션 및 SQL 지표까지 확인할 수 있는 기능을 제공한다. 이를 통해 문제가 발생한 시점 및 문제 원인 파악까지 한번에 진행할 수 있다.

Performance Trend 메뉴에 처음 진입하면 Overall 차트를 확인할 수 있다. 각 인스턴스 별 시간 구간 에서 CPU / Memory / 세션 / Wait Class 별 추이를 확인 할 수 있다.

## Overall 차트 소개

<figure><img src="https://2279005710-files.gitbook.io/~/files/v0/b/gitbook-x-prod.appspot.com/o/spaces%2FKFJJxDLiLb7KYeF0CGyF%2Fuploads%2FOTXXD9e8jNj6pBJOjvKy%2Fimage.png?alt=media&amp;token=c5ea6359-1051-4921-8903-084dc0d317f9" alt=""><figcaption></figcaption></figure>

Performance Trend의 Overall 차트에서는 조회 기간 동안의 CPU, Memory, Running Session, Wait Class의 값 변화 추이 및 요약 정보를 보여준다. 이때 시간, 날짜 단위별로 상세 분석할 수 있는 기능을 제공하며, 그래프별로 차트 간격(Interval)과 집계 방식(Aggregation)을 드롭다운 메뉴로 선택하여 확인할 수 있다. 또한 마우스를 보고자 하는 지표에 올리면 해당 지표 값을 확인할 수 있다.

차트를 클릭시 해당 시점의 1시간 범위 Time Slice 페이지로 전환되어 더 자세한 분석을 진행할 수 있다.

### CPU (Sys + User + IO)

<figure><img src="https://2279005710-files.gitbook.io/~/files/v0/b/gitbook-x-prod.appspot.com/o/spaces%2FKFJJxDLiLb7KYeF0CGyF%2Fuploads%2FCpxSGdxDFY1FS2LYPAyH%2Fimage.png?alt=media&amp;token=efe9c45b-17fd-411b-af16-5eb9cfe79a01" alt=""><figcaption></figcaption></figure>

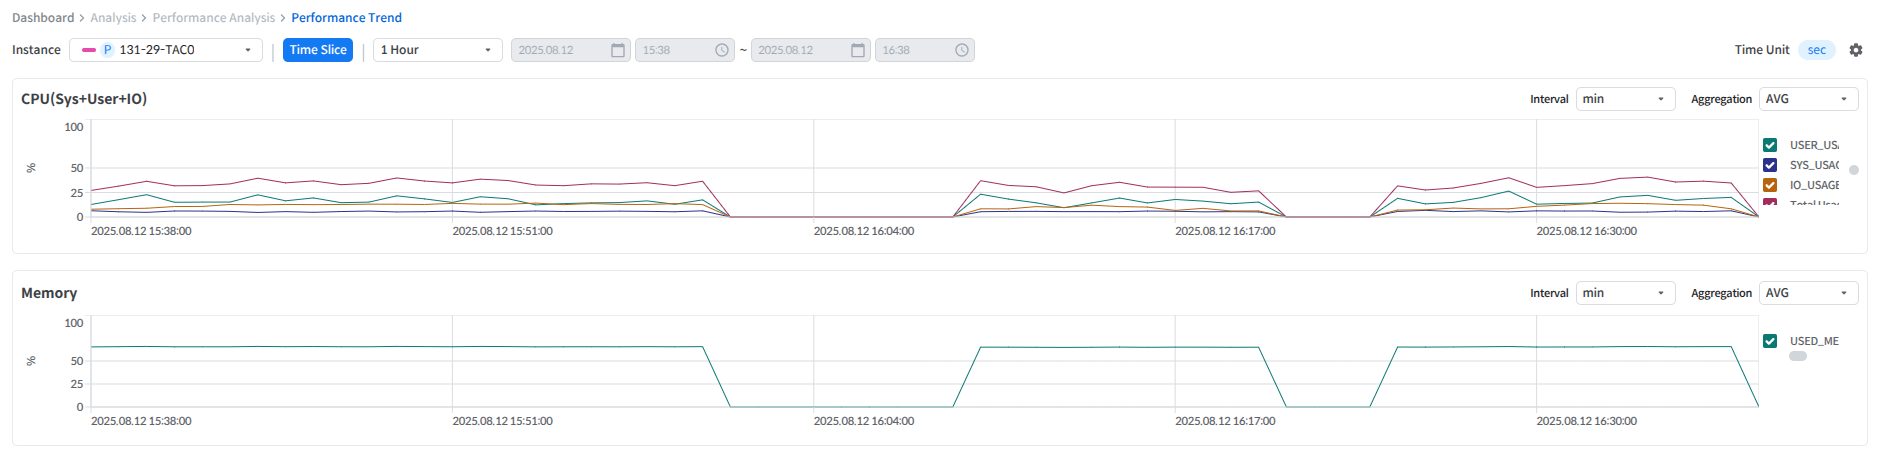
설정한 시간 구간 동안 CPU 사용량 변화 추이를 나타낸다.

### Memory

<figure><img src="https://2279005710-files.gitbook.io/~/files/v0/b/gitbook-x-prod.appspot.com/o/spaces%2FKFJJxDLiLb7KYeF0CGyF%2Fuploads%2FWQnL5O3nWFYr1nQY2bUl%2Fimage.png?alt=media&amp;token=2c333a0a-6d01-43d4-bb67-e61accd3dad0" alt=""><figcaption></figcaption></figure>

선택한 분석 기간 동안의 Memory 사용량 추이를 확인할 수 있다.

### Running Session

<figure><img src="https://2279005710-files.gitbook.io/~/files/v0/b/gitbook-x-prod.appspot.com/o/spaces%2FKFJJxDLiLb7KYeF0CGyF%2Fuploads%2FQKZxjZysWP7lET7HulSk%2Fimage.png?alt=media&amp;token=bc89c0ac-90c7-4b6a-aa1f-19106fc9c53e" alt=""><figcaption></figcaption></figure>

선택한 분석 기간 동안의 Running Session Count 추이를 확인할 수 있다.

### Wait Class

<figure><img src="https://2279005710-files.gitbook.io/~/files/v0/b/gitbook-x-prod.appspot.com/o/spaces%2FKFJJxDLiLb7KYeF0CGyF%2Fuploads%2FwEBrzrLYaEraHnopBnD1%2Fimage.png?alt=media&amp;token=fb6c68c7-26e7-413a-a9e3-7329a2767d3b" alt=""><figcaption></figcaption></figure>

선택한 분석 기간 동안 발생한 Wait Class Time의 추이를 확인할 수 있다.

{% hint style="info" %}
**참고**

Wait Class란 Tibero에서 작업 중 발생한 각 Wait Event들을 유형별로 정리한 것이다. 예를 들어 IO Class의 경우 IO 관련 작업을 할 때 발생한 Wait Event에서 소모된 시간 및 Wait Event 발생 횟수를 집계 것이다.
{% endhint %}

***

## Performance Chart 소개

<figure><img src="https://2279005710-files.gitbook.io/~/files/v0/b/gitbook-x-prod.appspot.com/o/spaces%2FKFJJxDLiLb7KYeF0CGyF%2Fuploads%2FbB4KO4OI9UhS3wUaacVR%2Fimage.png?alt=media&amp;token=43b06945-c7a9-4f73-82ff-6ca2d1d4233c" alt=""><figcaption></figcaption></figure>

Performance Chart는 Performance Trend에서 Time Slice 된 기간으로 조회되는 화면으로 CPU, Memory, Session, Wait Class 지표별 상세 분석이 가능하다.

상단과 중단 차트에서는 카테고리별로 세션 지표, DB 성능 통계 지표, 메모리 사용량, Wait Class 별 퍼센트 분포, 주요 Wait Event 별 Time / Count 지표, Wait Class 별 소모된 시간 정보의 시간 당 변화 추이를 확인할 수 있다.

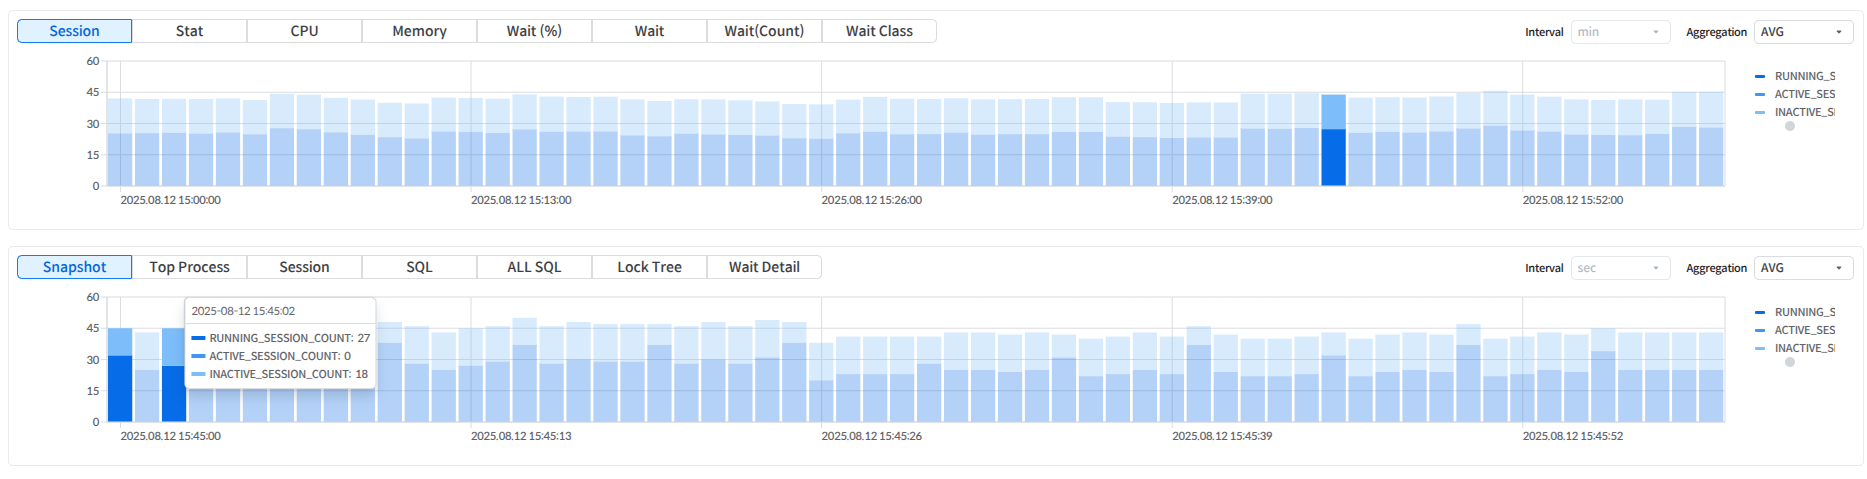
상단의 분단위 차트 클릭시 중간에 초 단위의 차트 그래프가 나타난다. 해당 초 단위 차트를 클릭하고 카테고리를 선택하면 해당 시점의 세션 관련 지표, 수행 SQL 관련 지표, Lock 관련 지표, Wait Event 관련 지표를 확인 할 수 있다.

다음은 Performance Chart 화면 상단에서 제공하는 차트에 대한 설명이다.

### Session

<figure><img src="https://2279005710-files.gitbook.io/~/files/v0/b/gitbook-x-prod.appspot.com/o/spaces%2FKFJJxDLiLb7KYeF0CGyF%2Fuploads%2FIZ0uIISO68Ax5qSF45pK%2Fimage.png?alt=media&amp;token=29bb1f06-0114-42b0-8591-f20e3e2c56d0" alt=""><figcaption></figcaption></figure>

시간 구간별 Running Session들의 정보를  Bar Chart로 제공한다. 이때 오른쪽 상단의 범례를 선택하여 원하는 지표를 선별할 수 있다. 또한 콤보박스를 통해 MIN, MAX, AVG 집계 방식을 선택 할 수 있다.

### Stat

<figure><img src="https://2279005710-files.gitbook.io/~/files/v0/b/gitbook-x-prod.appspot.com/o/spaces%2FKFJJxDLiLb7KYeF0CGyF%2Fuploads%2FpluO8KOTv0wGyTbXKyi3%2Fimage.png?alt=media&amp;token=70056e55-77c6-4436-b563-56ea8245a758" alt=""><figcaption></figcaption></figure>

지표(Logical Reads, Physical Reads, Redo Entries 등)별로 시간 구간 별 정보를 Bar Chart로 제공한다. 이때 오른쪽 상단의 범례를 선택하여 원하는 지표를 선별할 수 있다. 또한 콤보박스를 통해 MIN, MAX, AVG 집계 방식을 선택 할 수 있다.

### CPU

<figure><img src="https://2279005710-files.gitbook.io/~/files/v0/b/gitbook-x-prod.appspot.com/o/spaces%2FKFJJxDLiLb7KYeF0CGyF%2Fuploads%2F8LsJVhjeOXVkAWB5IZZp%2Fimage.png?alt=media&amp;token=a038a7db-a315-4b49-bed1-b65d70ceb753" alt=""><figcaption></figcaption></figure>

시간 구간별 CPU 사용률 정보를 제공한다. 이때 오른쪽 상단의 범례를 선택하여 System, IO, User Usage의 CPU 사용률에 대한 지표를 선별할 수 있다. 또한 콤보박스를 통해 MIN, MAX, AVG 집계 방식을 선택 할 수 있다.

### Memory

<figure><img src="https://2279005710-files.gitbook.io/~/files/v0/b/gitbook-x-prod.appspot.com/o/spaces%2FKFJJxDLiLb7KYeF0CGyF%2Fuploads%2F3fTLPC9nTW4gqcam102l%2Fimage.png?alt=media&amp;token=41de4abb-9bdd-4f23-b1d5-d94082b069ee" alt=""><figcaption></figcaption></figure>

시간 구간별 Memory 사용률 정보를 제공한다. 이때 오른쪽 상단의 범례를 선택하여 원하는 지표를 선별할 수 있다. 또한 콤보박스를 통해 MIN, MAX, AVG 집계 방식을 선택 할 수 있다.

### Wait (%)

<figure><img src="https://2279005710-files.gitbook.io/~/files/v0/b/gitbook-x-prod.appspot.com/o/spaces%2FKFJJxDLiLb7KYeF0CGyF%2Fuploads%2FLq5v3eBxazaWejd3dlfH%2Fimage.png?alt=media&amp;token=94874580-1cf1-4806-b5c5-8e4e122795e1" alt=""><figcaption></figcaption></figure>

Wait Class를 기반으로 같은 데이터지만 직관적인 분석이 가능하도록 백분율(%) 형태로 보여준다. 이 때 오른쪽 상단의 범례를 선택하여 원하는 지표를 선별할 수 있다. 또한 콤보박스를 통해 MIN, MAX, AVG 집계 방식을 선택 할 수 있다.

### Wait

<figure><img src="https://2279005710-files.gitbook.io/~/files/v0/b/gitbook-x-prod.appspot.com/o/spaces%2FKFJJxDLiLb7KYeF0CGyF%2Fuploads%2F4RNL8piYBTgLMNRYYjKB%2Fimage.png?alt=media&amp;token=54d7309f-cd63-4f31-8e0f-2971a91d022e" alt=""><figcaption></figcaption></figure>

주요 Wait Event에 대한 시간 구간별 정보를 Bar Chart로 제공한다. 해당 시간에 몇 초 동안 Event가 발생했는지 확인할 수 있다. 이때 오른쪽 상단의 범례를 선택하여 원하는 지표를 선별할 수 있다. 또한 콤보박스를 통해 MIN, MAX, AVG 집계 방식을 선택 할 수 있다.

### Wait (Count)

<figure><img src="https://2279005710-files.gitbook.io/~/files/v0/b/gitbook-x-prod.appspot.com/o/spaces%2FKFJJxDLiLb7KYeF0CGyF%2Fuploads%2FfYHuolqjyJf9p6QhugjB%2Fimage.png?alt=media&amp;token=e1303b16-fe57-4d2e-8256-4a73e6da652f" alt=""><figcaption></figcaption></figure>

주요 Wait Event에 대한 시간 구간별 정보를 Bar Chart로 제공한다. 해당 시점에 Wait Event가 몇 번 발생했는지 확인할 수 있다. 이때 오른쪽 상단의 범례를 선택하여 원하는 지표를 선별할 수 있다. 또한 콤보박스를 통해 MIN, MAX, AVG 집계 방식을 선택 할 수 있다.

### Wait Class

<figure><img src="https://2279005710-files.gitbook.io/~/files/v0/b/gitbook-x-prod.appspot.com/o/spaces%2FKFJJxDLiLb7KYeF0CGyF%2Fuploads%2FMro2hQyrIdqLq7EEPrJV%2Fimage.png?alt=media&amp;token=8c02f70d-1a73-4119-9cab-abf34c5f0d30" alt=""><figcaption></figcaption></figure>

Wait Event의 Class화된 정보를 Stacked Bar Chart 형태로 제공한다. 이때 오른쪽 상단의 범례를 선택하여 원하는 지표를 선별할 수 있다. 또한 콤보박스를 통해 MIN, MAX, AVG 집계 방식을 선택 할 수 있다.

###

***

## Performance Table 소개

다음은 Performance Chart 클릭 시 하단에 제공되는 테이블 카테고리에 관한 설명이다.

### Snapshot

<figure><img src="https://2279005710-files.gitbook.io/~/files/v0/b/gitbook-x-prod.appspot.com/o/spaces%2FKFJJxDLiLb7KYeF0CGyF%2Fuploads%2F4cFgwOBuTFl6vy44z5xC%2Fimage.png?alt=media&amp;token=8e859825-7c08-40ba-bd22-a0678763d192" alt=""><figcaption></figcaption></figure>

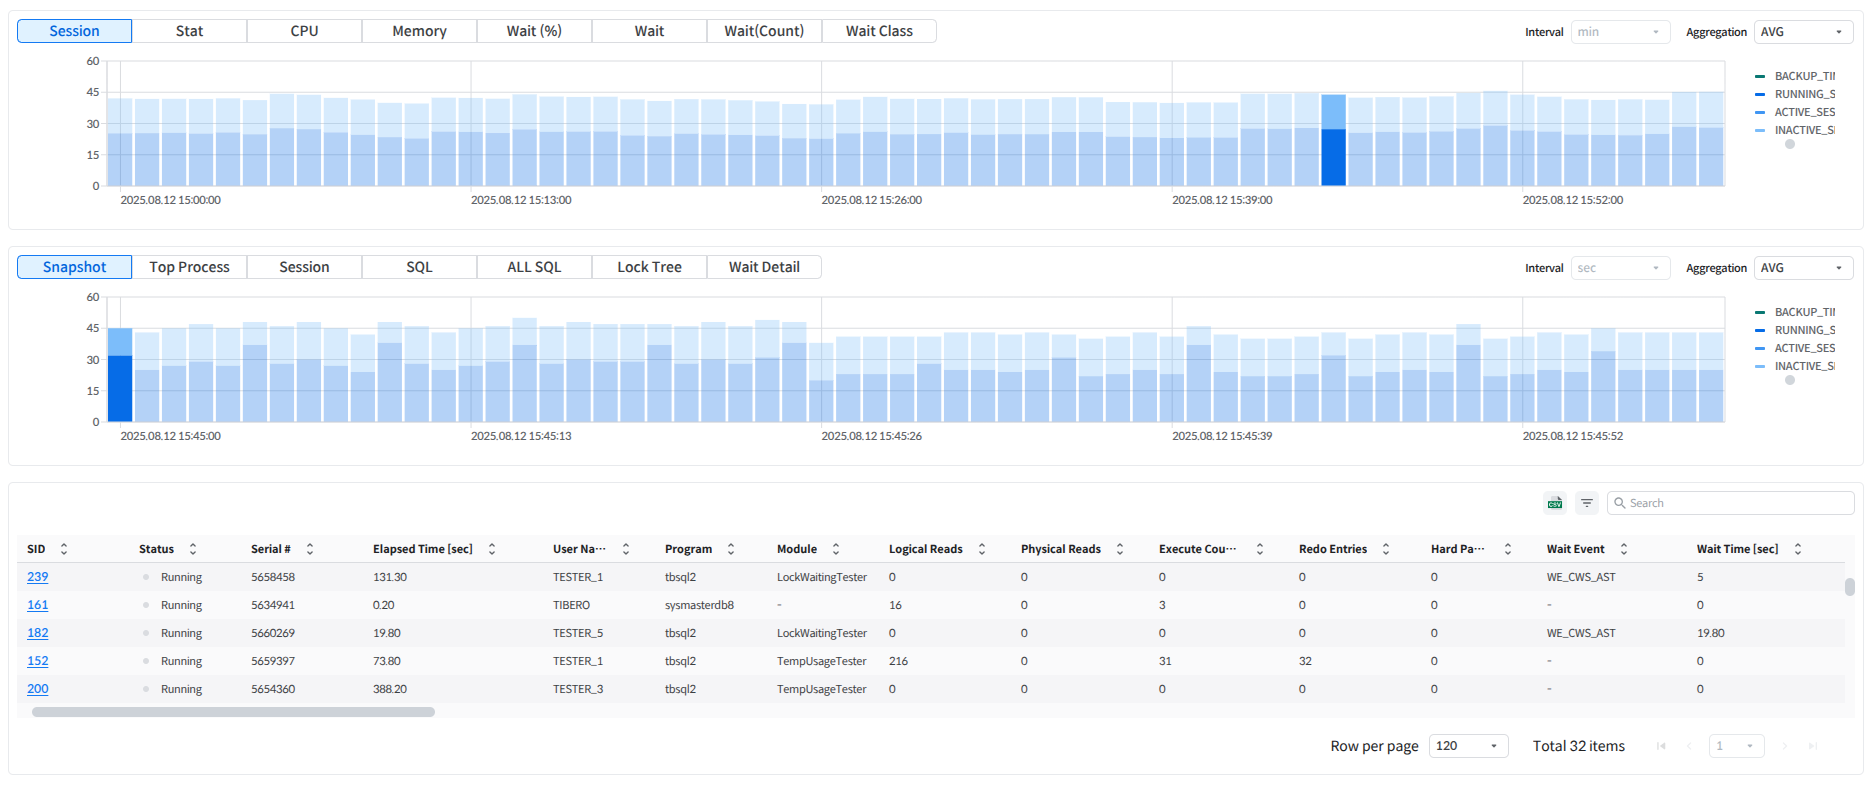
Performance Chart의 Snapshot 영역에서는 해당 시점의 Running Session의 Wait Class별 요약 정보와 각 세션의 SQL 수행 이력 등 해당 구간의 세션 정보들을 제공한다.

{% hint style="warning" %}
**주의**

Session 정보 수집에 사용하는 티베로 라이브러리 버전에 따라 일부 지표 (Username, Program, Module, Schema, OS User, Machine, Terminal 등) 가 수집되지 않을 수 있다.
{% endhint %}

| 항목                       | 설명                                                                                                                                                                                                                                                                                                                                                                                                                                                   |
| ------------------------ | ---------------------------------------------------------------------------------------------------------------------------------------------------------------------------------------------------------------------------------------------------------------------------------------------------------------------------------------------------------------------------------------------------------------------------------------------------- |
| **SID**                  | 세션의 ID                                                                                                                                                                                                                                                                                                                                                                                                                                               |
| **Serial #**             | 세션의 시리얼 번호                                                                                                                                                                                                                                                                                                                                                                                                                                           |
| **Elapsed Time**         | 세션의 현재 수행 중인 SQL의 Elapsed Time                                                                                                                                                                                                                                                                                                                                                                                                                       |
| **User Name**            | 현재 사용자 이름                                                                                                                                                                                                                                                                                                                                                                                                                                            |
| **Program**              | 세션의 프로그램 이름                                                                                                                                                                                                                                                                                                                                                                                                                                          |
| **Module**               | `dbms_application_info.set_module`로 지정된 모듈의 이름                                                                                                                                                                                                                                                                                                                                                                                                       |
| **Logical Reads**        | 세션의 Logical Reads 값                                                                                                                                                                                                                                                                                                                                                                                                                                  |
| **Physical Reads**       | 세션의 Physical Reads 값                                                                                                                                                                                                                                                                                                                                                                                                                                 |
| **Execute Counts**       | 세션의 Execute Count 값                                                                                                                                                                                                                                                                                                                                                                                                                                  |
| **Redo Entries**         | 세션의 Redo Entries 값                                                                                                                                                                                                                                                                                                                                                                                                                                   |
| **Hard Parse**           | 세션의 Hard Parse 값                                                                                                                                                                                                                                                                                                                                                                                                                                     |
| **Wait Event**           | 세션이 대기하는 Wait Event 타입                                                                                                                                                                                                                                                                                                                                                                                                                               |
| **Wait Time**            | 세션이 Wait Event로 대기한 시간                                                                                                                                                                                                                                                                                                                                                                                                                               |
| **Status**               | <p>세션의 상태<br>-<strong>READY</strong> : 세션 준비 상태<br>-<strong>RUNNING</strong> : 세션 Running 상태<br>-<strong>TX\_RECOVERING</strong> : 트랜젝션 복구 중 상태<br>-<strong>SESS\_CLEANUP</strong> : 세션 리소스 정리 중 상태<br>-<strong>ASSIGNED</strong> : 세션에 스레드가 할당되었지만 아직 준비되지 않은 상태 - <strong>CLOSING</strong> : 세션이 닫힌 상태<br>-<strong>ROLLING\_BACK</strong> : PE명세 레벨 트렌젝션의 Slave가 롤백된 상태</p>                                                                        |
| **State**                | <p>작업 스레드의 상태<br>-<strong>INVALID</strong> : 초기화 되지 않음<br>-<strong>NEW</strong> : 생성 중<br>-<strong>IDLE</strong> : 실행될 준비가 됨<br>-<strong>RUNNING</strong> : 실행 중<br>-<strong>WAITING</strong> : 내부 메시지 대기 중<br>-<strong>RECV\_WAITING</strong> : 클라이언트 메시지 대기 중<br>-<strong>STOP\_BY\_MTHR</strong> : 모니터링 프로세스에 의해 중지됨<br>-<strong>DEAD</strong> : Dead 상태</p>                                                                                      |
| **PGA Memory (Session)** | 세션의 PGA 메모리 사용량                                                                                                                                                                                                                                                                                                                                                                                                                                      |
| **SQL Trace**            | 세션에서 SQL 추적을 사용할지 여부                                                                                                                                                                                                                                                                                                                                                                                                                                 |
| **Wlock Wait**           | 세션이 대기 중인 Wait 타입                                                                                                                                                                                                                                                                                                                                                                                                                                    |
| **Audsid**               | 세션의 두 번째 시리얼 번호                                                                                                                                                                                                                                                                                                                                                                                                                                      |
| **User ID**              | User ID 정보                                                                                                                                                                                                                                                                                                                                                                                                                                           |
| **IP Address**           | User 접속 IP 주소                                                                                                                                                                                                                                                                                                                                                                                                                                        |
| **TX\_UNDO\_BLK\_CNT**   | Transaction Undo Block 개수                                                                                                                                                                                                                                                                                                                                                                                                                            |
| **TX\_UNDO\_REC\_CNT**   | Transaction Undo Record 개수                                                                                                                                                                                                                                                                                                                                                                                                                           |
| **Command**              | <p>현재 실행 중인 SQL 타입<br>-<strong>0</strong> : 실행 중인 SQL 없음<br>-<strong>1</strong> : SELECT<br>-<strong>2</strong> : INSERT<br>-<strong>3</strong> : UPDATE<br>-<strong>4</strong> : DELETE<br>-<strong>5</strong> : MERGE<br>-<strong>6</strong> : CALL</p>                                                                                                                                                                                            |
| **Schema**               | 세션의 스키마                                                                                                                                                                                                                                                                                                                                                                                                                                              |
| **Thr Type**             | <p>세션의 타입<br>-<strong>WTHR</strong> : Working thread<br>-<strong>CTHR</strong> : Control thread<br>-<strong>LGWR</strong> : Log writing process<br>-<strong>CKPT</strong> : Checkpoint process<br>-<strong>LARC</strong> : Log archive<br>-<strong>AGENT</strong> : Sequence process<br>-<strong>MTHR</strong> : Monitoring process<br>-<strong>DBWR</strong> : Datablock writing process<br>-<strong>LNW</strong> : Log network writing process</p> |
| **SQL ID**               | 세션이 수행 중인 SQL의 SQL ID                                                                                                                                                                                                                                                                                                                                                                                                                                |
| **Child Number**         | 세션이 수행 중인 SQL ID의 Child Number 값                                                                                                                                                                                                                                                                                                                                                                                                                     |
| **Prev SQL ID**          | 마지막으로 수행된 SQL의 SQL ID                                                                                                                                                                                                                                                                                                                                                                                                                                |
| **Prev Child Number**    | 마지막으로 수행된 SQL ID의 Child Number 값                                                                                                                                                                                                                                                                                                                                                                                                                     |
| **Logon Time**           | 세션의 로그온 시간                                                                                                                                                                                                                                                                                                                                                                                                                                           |
| **Client PID**           | 세션의 Client PID                                                                                                                                                                                                                                                                                                                                                                                                                                       |
| **PID**                  | 세션이 속한 프로세스의 식별자                                                                                                                                                                                                                                                                                                                                                                                                                                     |
| **OS User**              | 연결된 세션의 OS 계정 이름                                                                                                                                                                                                                                                                                                                                                                                                                                     |
| **Machine**              | 연결된 세션의 호스트 이름                                                                                                                                                                                                                                                                                                                                                                                                                                       |
| **Terminal**             | 연결된 세션의 터미널(TTY) 정보                                                                                                                                                                                                                                                                                                                                                                                                                                  |
| **Action**               | `dbms_application_info.set_module/action`으로 지정된 액션의 이름                                                                                                                                                                                                                                                                                                                                                                                               |
| **Client Info**          | `dbms_application_info.set_client_info`로 지정된 client\_info의 이름                                                                                                                                                                                                                                                                                                                                                                                        |
| **Client Identifier**    | `dbms_session.set_identifier`로 지정된 client ID의 이름                                                                                                                                                                                                                                                                                                                                                                                                     |
| **Backup Wait**          | Backup Wait로 대기한 시간                                                                                                                                                                                                                                                                                                                                                                                                                                  |
| **DD Wait**              | DD Wait로 대기한 시간                                                                                                                                                                                                                                                                                                                                                                                                                                      |
| **DDL Wait**             | DDL Wait로 대기한 시간                                                                                                                                                                                                                                                                                                                                                                                                                                     |
| **Internal Wait**        | Internal Wait로 대기한 시간                                                                                                                                                                                                                                                                                                                                                                                                                                |
| **IO Wait**              | IO Wait로 대기한 시간                                                                                                                                                                                                                                                                                                                                                                                                                                      |
| **PSM Wait**             | PSM Wait로 대기한 시간                                                                                                                                                                                                                                                                                                                                                                                                                                     |
| **Recovery Tac Wait**    | Recovery Tac Wait로 대기한 시간                                                                                                                                                                                                                                                                                                                                                                                                                            |
| **Recovery Wait**        | Recovery Wait로 대기한 시간                                                                                                                                                                                                                                                                                                                                                                                                                                |
| **Redo Tac Wait**        | Redo Tac Wait로 대기한 시간                                                                                                                                                                                                                                                                                                                                                                                                                                |
| **Redo Wait**            | Redo Wait로 대기한 시간                                                                                                                                                                                                                                                                                                                                                                                                                                    |
| **Resource Wait**        | Resource Wait로 대기한 시간                                                                                                                                                                                                                                                                                                                                                                                                                                |
| **Session Wait**         | Session Wait로 대기한 시간                                                                                                                                                                                                                                                                                                                                                                                                                                 |
| **Space Wait**           | Space Wait로 대기한 시간                                                                                                                                                                                                                                                                                                                                                                                                                                   |
| **Sql Tac Wait**         | Sql Tac Wait로 대기한 시간                                                                                                                                                                                                                                                                                                                                                                                                                                 |
| **Standby Wait**         | Standby Wait로 대기한 시간                                                                                                                                                                                                                                                                                                                                                                                                                                 |
| **Wlock Wait**           | Wlock Wait로 대기한 시간                                                                                                                                                                                                                                                                                                                                                                                                                                   |
| **Xa Wait**              | Xa Wait로 대기한 시간                                                                                                                                                                                                                                                                                                                                                                                                                                      |

### Top Process

<figure><img src="https://content.gitbook.com/content/KFJJxDLiLb7KYeF0CGyF/blobs/7rt4GEIYtcu2S6ZFZUiP/image.png" alt=""><figcaption></figcaption></figure>

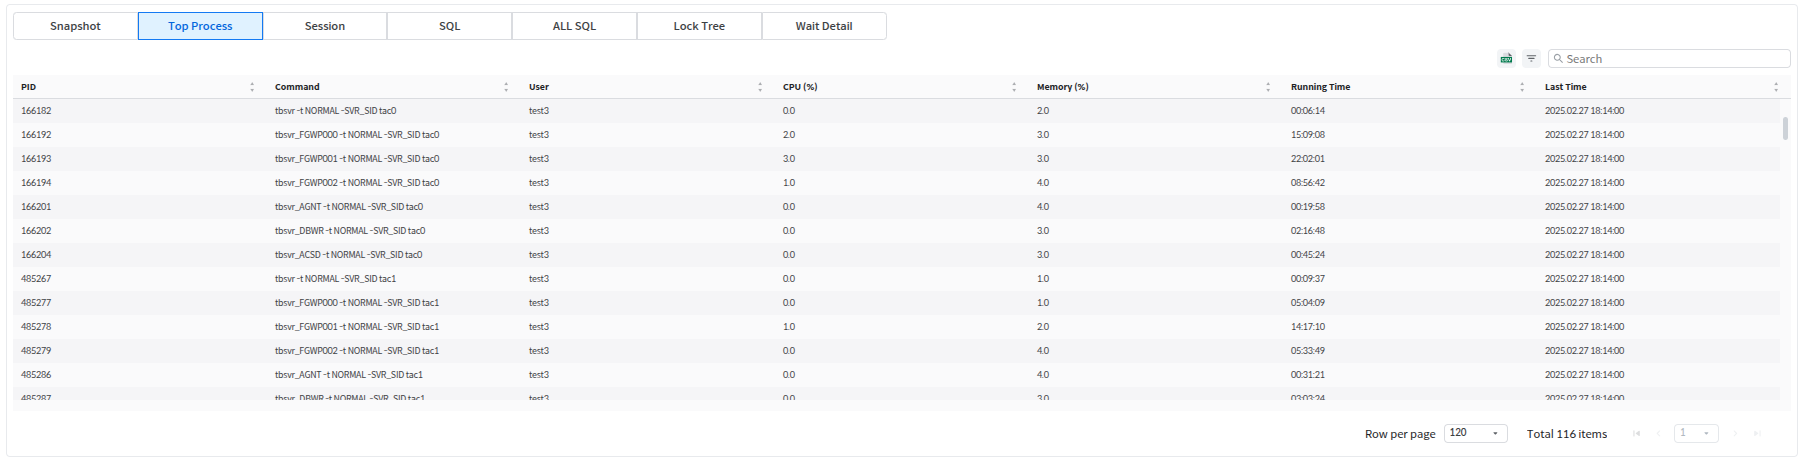
Top Process 카테고리에서는 시간 구간별로 OS Level의 CPU 와 Memory 자원 사용량이 많은 프로세스 정보를 집계해서 프로세스별 사용 Resource를 보여준다.

| 항목           | 설명                 |
| ------------ | ------------------ |
| PID          | 프로세스의 OS PID 값     |
| Command      | 프로세스의 OS Command   |
| User         | OS 사용자 이름          |
| CPU (%)      | 프로세스 레벨의 CPU 사용률   |
| Memory       | 메모리 사용량            |
| Running Time | 프로세스의 Running Time |
| Last Time    | 프로세스의 Last Time    |

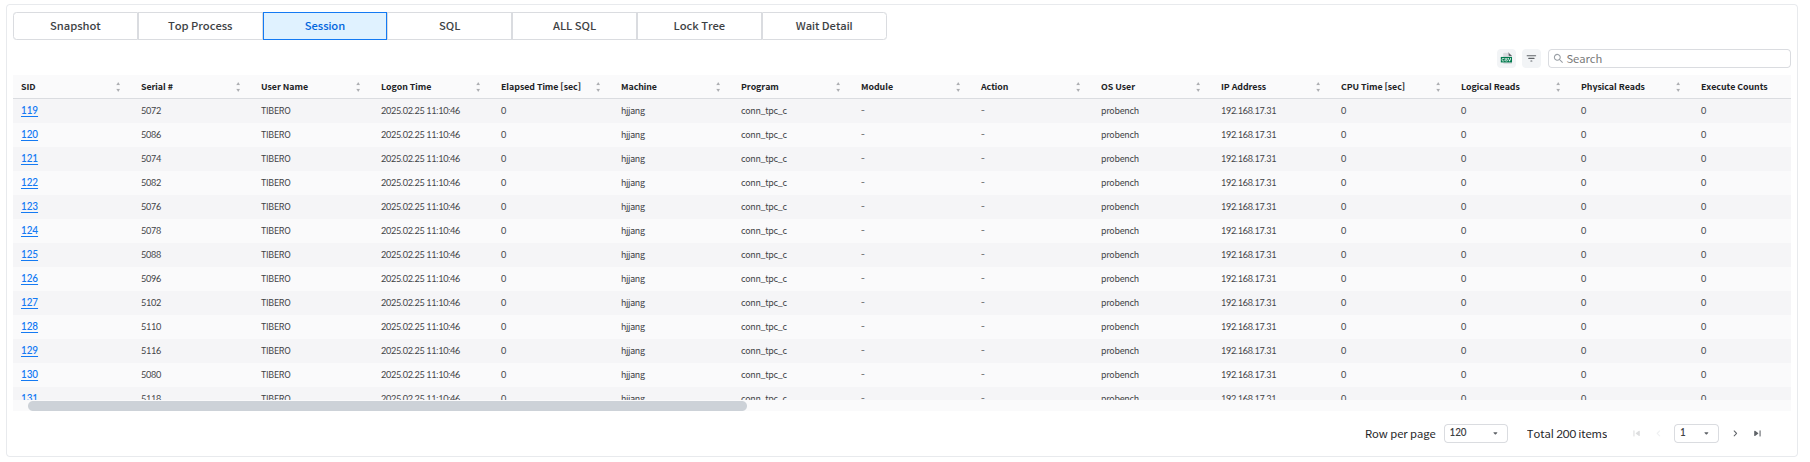
### Session

<figure><img src="https://content.gitbook.com/content/KFJJxDLiLb7KYeF0CGyF/blobs/CYotbLDvgQNRmAg2hOCB/image.png" alt=""><figcaption></figcaption></figure>

Performance Chart의 Session 영역에서는 상단의 그래프를 클릭했을 때 해당 시간 구간의 Running Session목록을 보여준다.

{% hint style="info" %}
**참고**

Snapshot과 Session의 차이:

* Snapshot: 각 세션의 매 초당 상태 변화를 확인하기 위한 카테고리
* Session: 1분 이상의 구간동안에서 세션의 전체적인 지표를 확인하기 위한 카테고리.
  {% endhint %}

| 항목                | 설명                                                      |
| ----------------- | ------------------------------------------------------- |
| SID               | 세션의 ID                                                  |
| Serial #          | 세션의 시리얼 번호                                              |
| User Name         | 현재 사용자 이름                                               |
| Logon Time        | 세션의 로그온 시간                                              |
| Elapsed Time      | 세션의 현재 수행 중인 SQL의 Elapsed Time                          |
| Machine           | 연결된 세션의 호스트 이름                                          |
| Program           | 세션의 프로그램 이름                                             |
| Module            | dbms\_application\_info.set\_module로 지정된 모듈의 이름         |
| Action            | dbms\_application\_info.set\_module/action으로 지정된 액션의 이름 |
| OS User           | 연결된 세션의 OS 계정 이름                                        |
| IP Address        | User 접속 IP 주소                                           |
| CPU Time          | 세션의 CPU 사용 시간                                           |
| Logical Reads     | 세션의 Logical Reads 값                                     |
| Physical Reads    | 세션의 Physical Reads 값                                    |
| Execute Counts    | 세션의 Execute Count 값                                     |
| Redo Entries      | 세션의 Redo Entries 값                                      |
| Hard Parse        | 세션의 Hard Parse 값                                        |
| Backup Wait       | Backup Wait로 대기한 시간                                     |
| DD Wait           | DD Wait로 대기한 시간                                         |
| DDL Wait          | DDL Wait로 대기한 시간                                        |
| Internal Wait     | Internal Wait로 대기한 시간                                   |
| IO Wait           | IO Wait로 대기한 시간                                         |
| PSM Wait          | PSM Wait로 대기한 시간                                        |
| Recovery Tac Wait | Recovery Tac Wait로 대기한 시간                               |
| Recovery Wait     | Recovery Wait로 대기한 시간                                   |
| Redo Tac Wait     | Redo Tac Wait로 대기한 시간                                   |
| Redo Wait         | Redo Wait로 대기한 시간                                       |
| Resource Wait     | Resource Wait로 대기한 시간                                   |
| Session Wait      | Session Wait로 대기한 시간                                    |
| Space Wait        | Space Wait로 대기한 시간                                      |
| Sql Tac Wait      | Sql Tac Wait로 대기한 시간                                    |
| Standby Wait      | Standby Wait로 대기한 시간                                    |
| Wlock Wait        | Wlock Wait로 대기한 시간                                      |
| Xa Wait           | Xa Wait로 대기한 시간                                         |

{% hint style="info" %}
**참고**

Session은 해당 시간 구간에서 Session의 전체적인 지표를 나타내는 지표이다.

Session의 경우에는 해당 시간 구간에서 Session의 전체적인 지표를 파악할 수 있다.
{% endhint %}

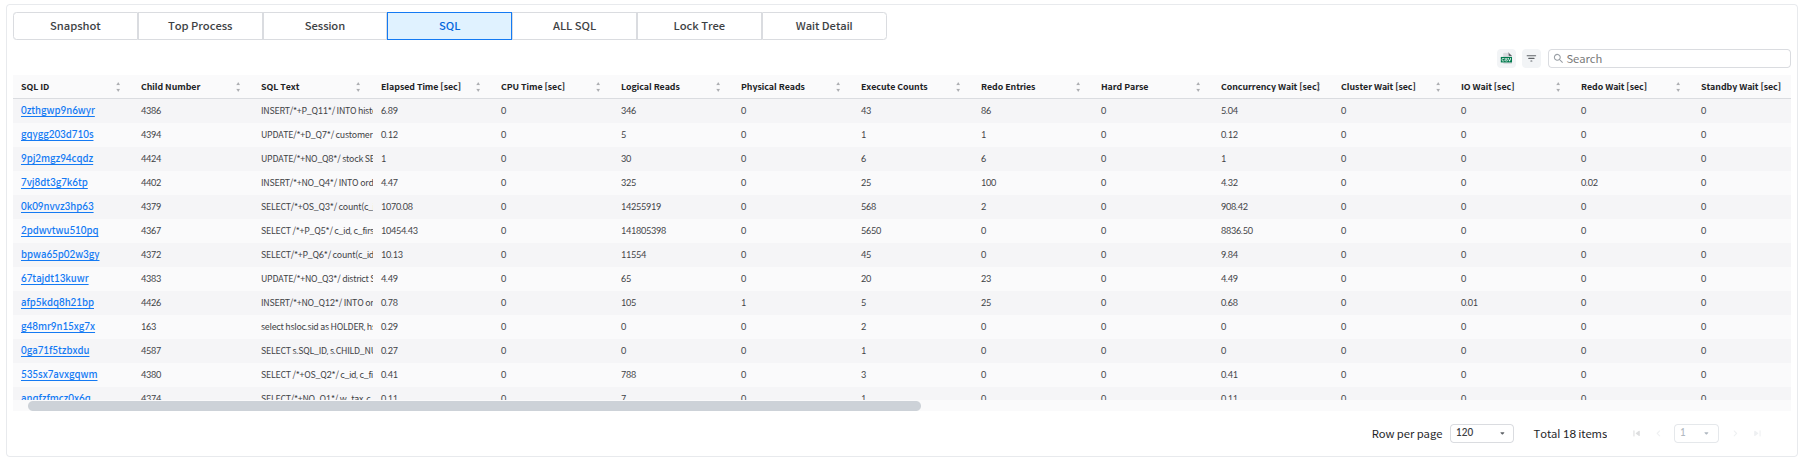
### SQL

<figure><img src="https://content.gitbook.com/content/KFJJxDLiLb7KYeF0CGyF/blobs/g8xn4fFqauCDS4fsg2iK/image.png" alt=""><figcaption></figcaption></figure>

Performance Chart의 SQL 영역에서는 상단의 그래프를 클릭했을 때 해당 구간의 각 세션에서 수행한 SQL 목록을 보여준다. SQL ID 클릭시 해당 SQL 에 대한 SQL Detail 페이지로 전환된다.

| 항목명              | 설명                         |
| ---------------- | -------------------------- |
| SQL ID           | 수행 중인 SQL의 SQL ID          |
| Child Number     | 수행 중인 SQL의 Child Number 값  |
| SQL Text         | SQL 내용                     |
| Elapsed Time     | 현재 수행 중인 SQL의 Elapsed Time |
| Execute Counts   | SQL 실행 횟수                  |
| CPU Time         | CPU 사용 시간                  |
| Logical Reads    | Memory I/O로 읽은 Block 수     |
| Physical Reads   | Block I/O로 읽은 Block 수      |
| Redo Entries     | Redo Entries의 개수           |
| Hard Parse       | SQL의 Hard Parse 값          |
| Application Wait | Application Wait로 대기한 시간   |
| Cache Wait       | Cache Wait로 대기한 시간         |
| Cluster Wait     | Cluster Wait로 대기한 시간       |
| Concurrency Wait | Concurrency로 대기한 시간        |
| Other Wait       | Other Wait로 대기한 시간         |
| SQL Wait         | SQL Wait로 대기한 시간           |
| System IO Wait   | System I/O Wait로 대기한 시간    |
| User IO Wait     | User I/O Wait로 대기한 시간      |

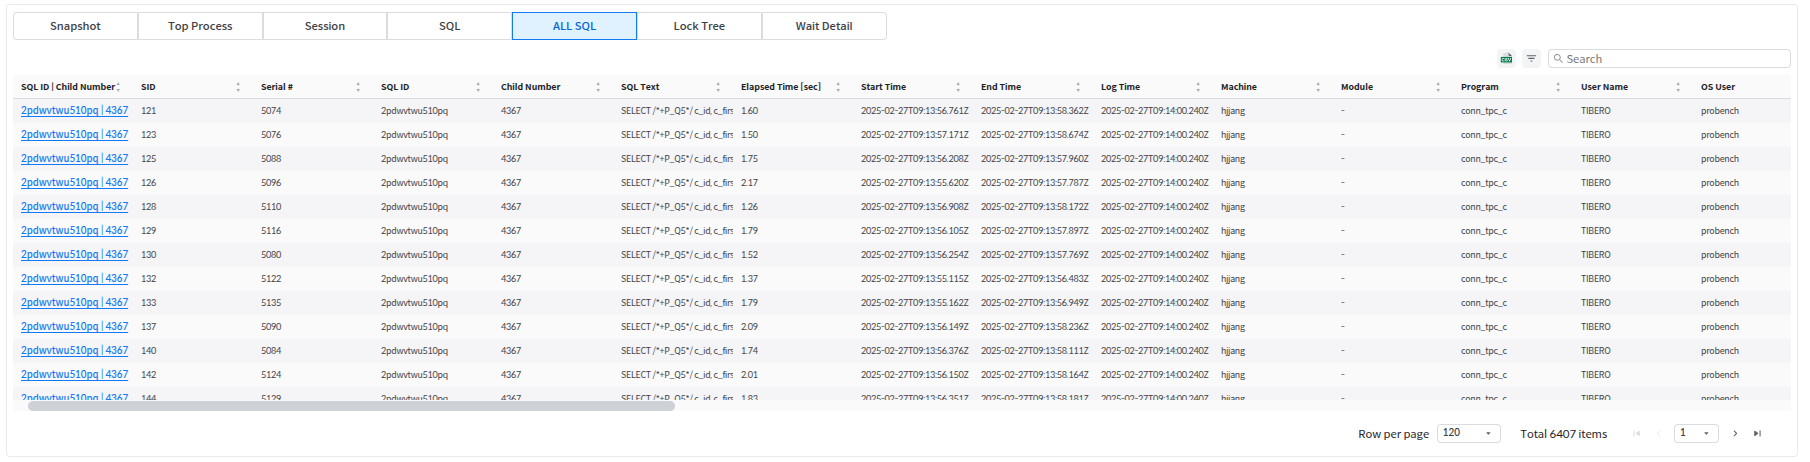
### All SQL

<figure><img src="https://content.gitbook.com/content/KFJJxDLiLb7KYeF0CGyF/blobs/IftnEdmJXnO04chXj4jn/image.png" alt=""><figcaption></figcaption></figure>

Performance Chart의 All SQL 영역에서는 상단의 그래프를 클릭했을 때 해당 시간 구간 동안 수행된 모든 SQL 목록을 보여준다.

| 항목                     | 설명                                              |
| ---------------------- | ----------------------------------------------- |
| SQL ID \| Child Number | 세션이 수행 중인 SQL의 SQL ID 와 Child Number 값 쌍        |
| SID                    | 세션의 ID                                          |
| Serial #               | 세션의 시리얼 번호                                      |
| SQL ID                 | 세션이 수행 중인 SQL의 SQL ID                           |
| Child Number           | 세션이 수행 중인 SQL의 Child Number                     |
| SQL Text               | SQL 내용                                          |
| Elapsed Time           | 현재 수행 중인 SQL의 Elapsed Time                      |
| Start Time             | SQL의 시작 시간                                      |
| End Time               | SQL의 끝난 시간                                      |
| Log Time               | 해당 SQL 수행이 시스마스터에 기록된 시간                        |
| Machine                | 연결된 세션의 호스트 이름                                  |
| Module                 | dbms\_application\_info.set\_module로 지정된 모듈의 이름 |
| Program                | 세션의 프로그램 이름                                     |
| User Name              | 현재 사용자 이름                                       |
| OS User                | 연결된 세션의 OS 계정 이름                                |
| CPU Time               | 세션의 CPU 사용 시간                                   |
| Logical Reads          | 세션의 Logical Reads 값                             |
| Physical Reads         | 세션의 Physical Reads 값                            |
| Execute Counts         | 세션의 Execute Count 값                             |
| Redo Entries           | 세션의 Redo Entries 값                              |
| Hard Parse             | 세션의 Hard Parse 값                                |
| Backup Wait            | Backup Wait로 대기한 시간                             |
| DD Wait                | DD Wait로 대기한 시간                                 |
| DDL Wait               | DDL Wait로 대기한 시간                                |
| Internal Wait          | Internal Wait로 대기한 시간                           |
| IO Wait                | IO Wait로 대기한 시간                                 |
| PSM Wait               | PSM Wait로 대기한 시간                                |
| Recovery Tac Wait      | Recovery Tac Wait로 대기한 시간                       |
| Recovery Wait          | Recovery Wait로 대기한 시간                           |
| Redo Tac Wait          | Redo Tac Wait로 대기한 시간                           |
| Redo Wait              | Redo Wait로 대기한 시간                               |
| Resource Wait          | Resource Wait로 대기한 시간                           |
| Session Wait           | Session Wait로 대기한 시간                            |
| Space Wait             | Space Wait로 대기한 시간                              |
| Sql Tac Wait           | Sql Tac Wait로 대기한 시간                            |
| Standby Wait           | Standby Wait로 대기한 시간                            |
| Wlock Wait             | Wlock Wait로 대기한 시간                              |
| Xa Wait                | Xa Wait로 대기한 시간                                 |

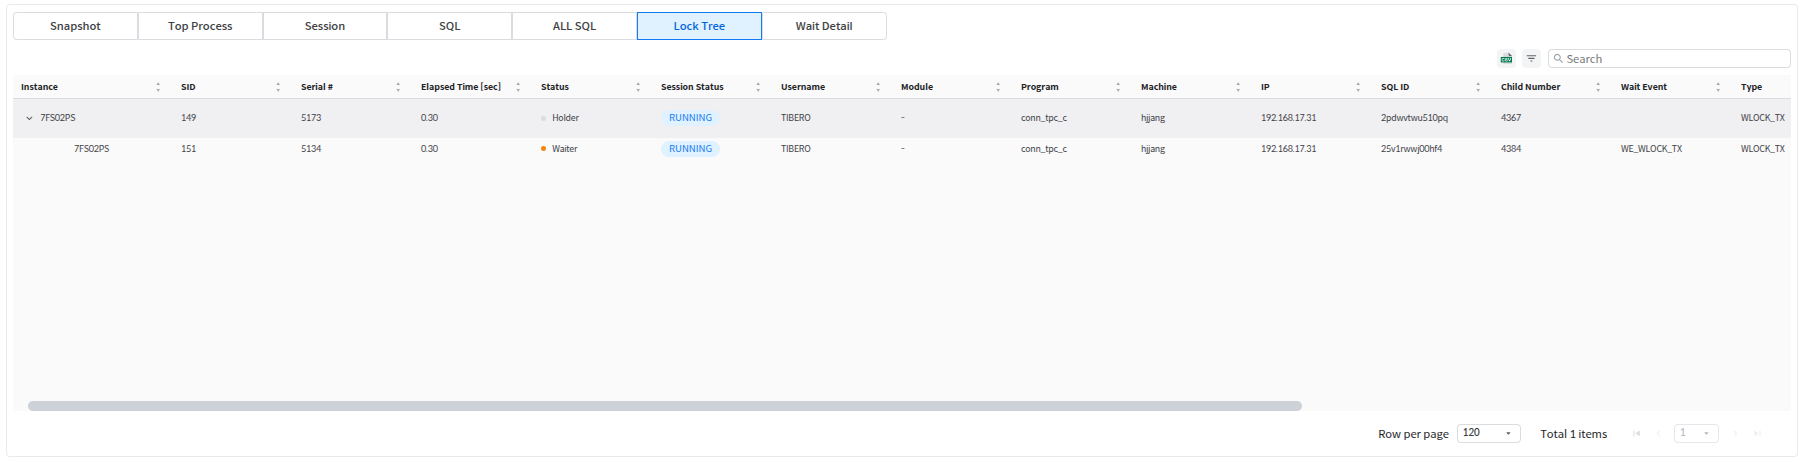
### Lock Tree

<figure><img src="https://content.gitbook.com/content/KFJJxDLiLb7KYeF0CGyF/blobs/UKIjdc7ymqPHghUvWfqA/image.png" alt=""><figcaption></figcaption></figure>

Performance Chart의 Lock Tree 영역에서는 상단의 그래프를 클릭했을 때 해당 구간 동안 세션 간의 Transaction Lock으로 인해 발생한 Wait 상황을 Tree 형태로 제공한다.

| 항목             | 설명                                  |
| -------------- | ----------------------------------- |
| Instance       | 데이터베이스 인스턴스 번호                      |
| SID            | 세션의 SID                             |
| Serial #       | 세션의 시리얼 번호                          |
| Elapsed Time   | 세션의 Running 시간                      |
| Status         | 세션의 Holder 및 Waiter 정보              |
| Session Status | 세션의 상태                              |
| Wait Time      | 대기한 시간                              |
| User Name      | 세션 사용자 이름                           |
| Module         | 세션의 모듈 이름                           |
| Program        | 세션의 프로그램 이름                         |
| Machine        | 세션의 호스트 이름                          |
| IP Addr        | User 접속 IP 주소                       |
| SQL ID         | 세션이 수행 중인 SQL의 SQL ID               |
| Child Number   | 세션이 수행 중인 SQL Plan의 Child Number 값  |
| Wait Event     | 세션의 Wait Event 이름                   |
| Type           | Lock 타입                             |
| ID1            | Lock ID1                            |
| ID2            | Lock ID2                            |
| Mode           | Holder 가 점유한 Lock 모드 (Waiter는 항상 0) |
| Request        | Waiter 가 요청한 Lock 모드 (Holder는 항상 0) |

### Wait Detail

<figure><img src="https://content.gitbook.com/content/KFJJxDLiLb7KYeF0CGyF/blobs/LtuYOXyzib8I2M6oPJvS/image.png" alt=""><figcaption></figcaption></figure>

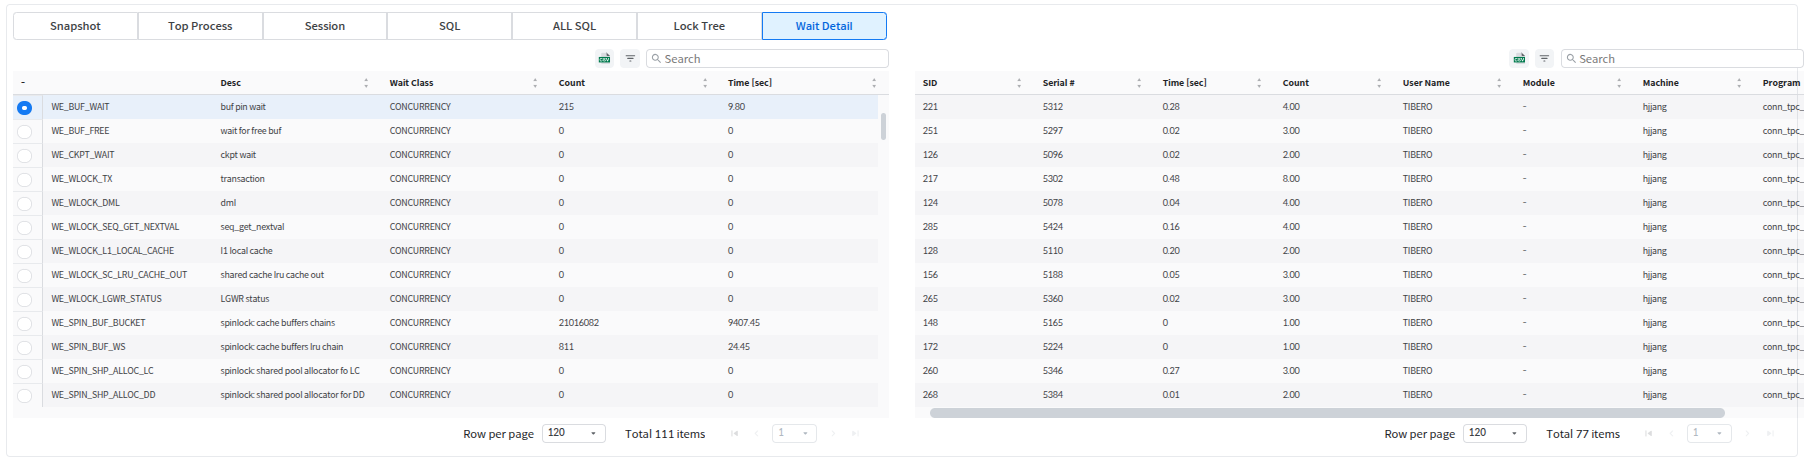
Performance Chart의 Wait Detail 영역에서는 상단의 그래프를 클릭했을 때 1분 동안 발생한 Wait Event를 집계해서 보여주고, 특정 Wait Event를 클릭하면 Wait Event가 발생했던 세션 목록을 오른쪽에 보여준다.

#### Wait Event 영역

| 항목         | 설명               |
| ---------- | ---------------- |
| Name       | Wait Event 이름    |
| Desc       | Wait Event 상세 설명 |
| Wait Class | Wait Class 이름    |
| Count      | Wait Event 발생 횟수 |
| Time       | Wait Event 대기 시간 |

#### Wait Session 영역

| 항목        | 설명                                              |
| --------- | ----------------------------------------------- |
| SID       | 세션의 ID                                          |
| Serial #  | 세션의 시리얼 번호                                      |
| Time      | Wait Event 대기 시간                                |
| Count     | Wait Event 발생 횟수                                |
| User Name | 현재 사용자 이름                                       |
| Module    | dbms\_application\_info.set\_module로 지정된 모듈의 이름 |
| OS User   | 연결된 세션의 OS 계정 이름                                |
| Machine   | 연결된 세션의 호스트 이름                                  |
| Program   | 세션의 프로그램 이름                                     |

###