> For the complete documentation index, see [llms.txt](https://docs.tibero.com/sysmasterdb/llms.txt). Markdown versions of documentation pages are available by appending `.md` to page URLs; this page is available as [Markdown](https://docs.tibero.com/sysmasterdb/8.3_manual/analysis/history-analysis/alert-event-analysis.md).
# Alert Event Analysis
글로벌 내비게이션 바에서 **\[Analysis] > \[History Analysis] > \[Alert Event Analysis]** 페이지를 클릭하면 Alert Analysis 페이지가 열린다.
Alert Event Analysis 페이지에서는 SysMaster DB 8 제품의 사용자가 설정한 알림 및 시스템 알림 규칙 대한 알림 발생 이력을 확인할 수 있다. 또한 발생한 알림에 대한 확인 여부도 확인할 수 있다.
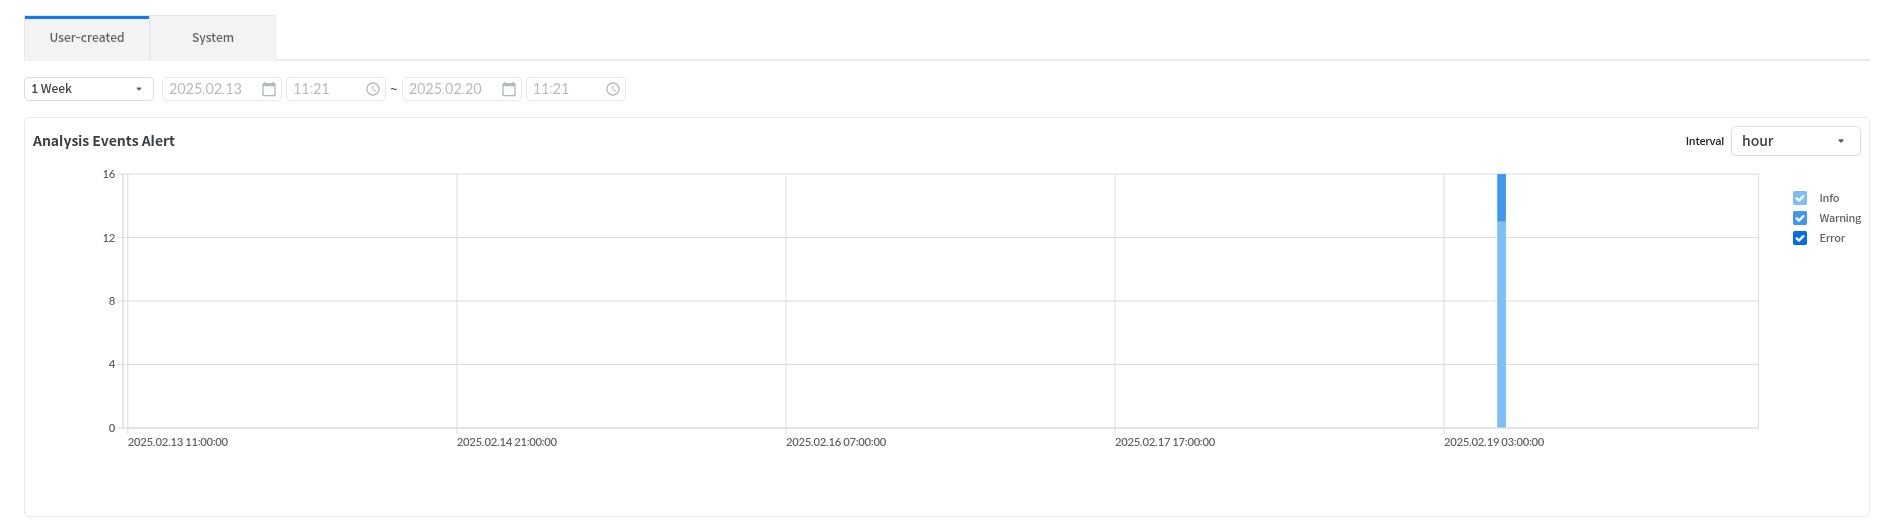
### User-created
시간 범위를 설정하여 사용자 설정 알림 발생 정보를 차트로 조회하여 볼 수 있다.
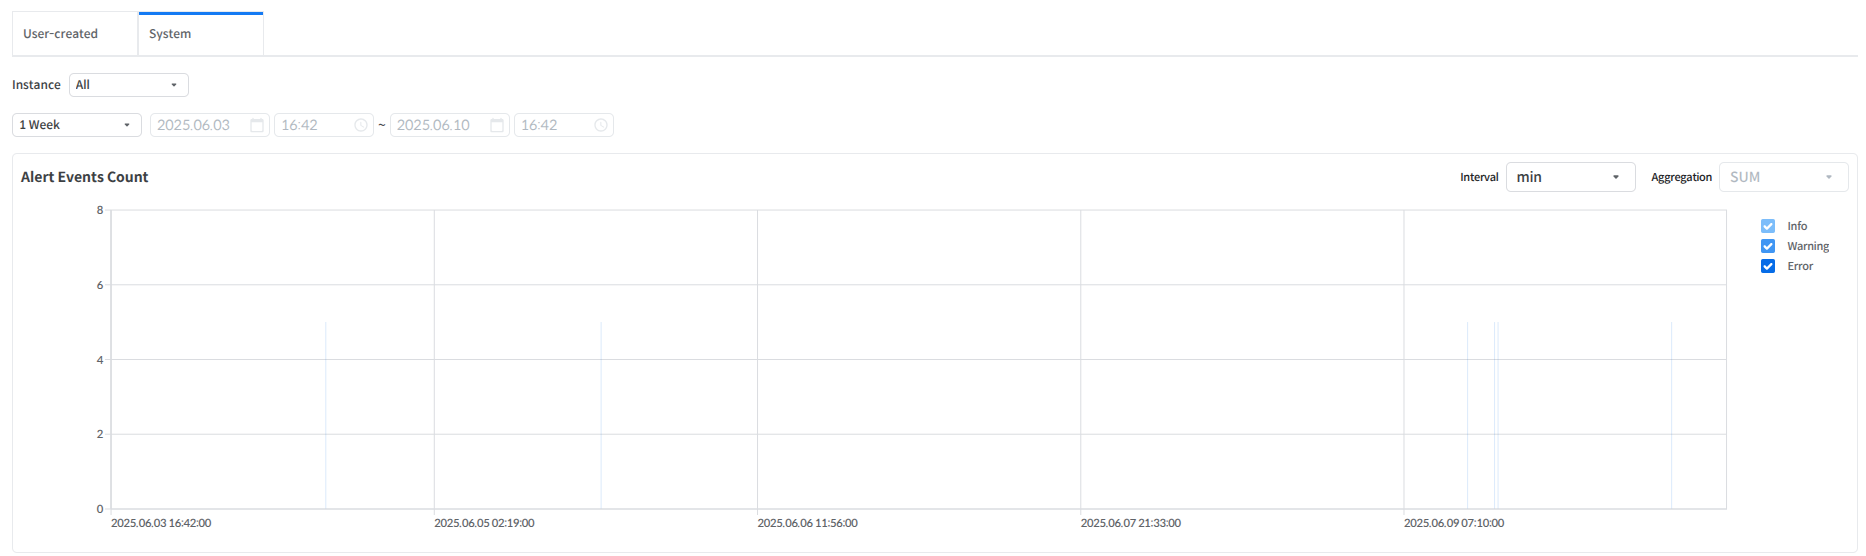
### System
시간 범위를 설정하여 사용자 설정 알림 발생 정보를 차트로 조회하여 볼 수 있다.
### Alert Event 목록
User created 탭과 System 탭 차트의 특정 시간을 클릭하여 해당 시간의 알림 목록을 조회할 수 있다.
| 항목 | 설명 |
| ------------- | ---------------------------- |
| Alert Time | 알림이 발생한 시각 |
| Alert Name | 알림 이름 |
| Alert Level | 알림 레벨 (INFO, WARNING, ERROR) |
| Alert Trigger | 알람 트리거 이름 |
| Instance | 알림이 발생한 인스턴스 이름 |
| Confirm | 사용자 확인 여부 |
| User Comment | 알림 확인 시 사용자가 작성한 메시지 내용 |
###
---
# Agent Instructions
This documentation is published with GitBook. GitBook is the documentation platform designed so that both humans and AI agents can read, navigate, and reason over technical content effectively. Learn more at gitbook.com.
## Querying This Documentation
If you need additional information that is not directly available in this page, you can query the documentation dynamically by asking a question.
Perform an HTTP GET request on the current page URL with the `ask` query parameter, and the optional `goal` query parameter:
```
GET https://docs.tibero.com/sysmasterdb/8.3_manual/analysis/history-analysis/alert-event-analysis.md?ask=&goal=
```
`ask` is the immediate question: it should be specific, self-contained, and written in natural language.
`goal` is optional and describes the broader end goal you are ultimately trying to accomplish on behalf of the user. GitBook uses it to tailor the answer towards what is most useful for that goal.
The response will contain a direct answer to the question and relevant excerpts and sources from the documentation.
Use this mechanism when the answer is not explicitly present in the current page, you need clarification or additional context, or you want to retrieve related documentation sections.